Skip to content
KONIGI

Dashboards · Genres

Tactical

Checked daily or weekly by the person running a function.

2 captures

Patterns seen in this genre 6

Captures

Newest first.
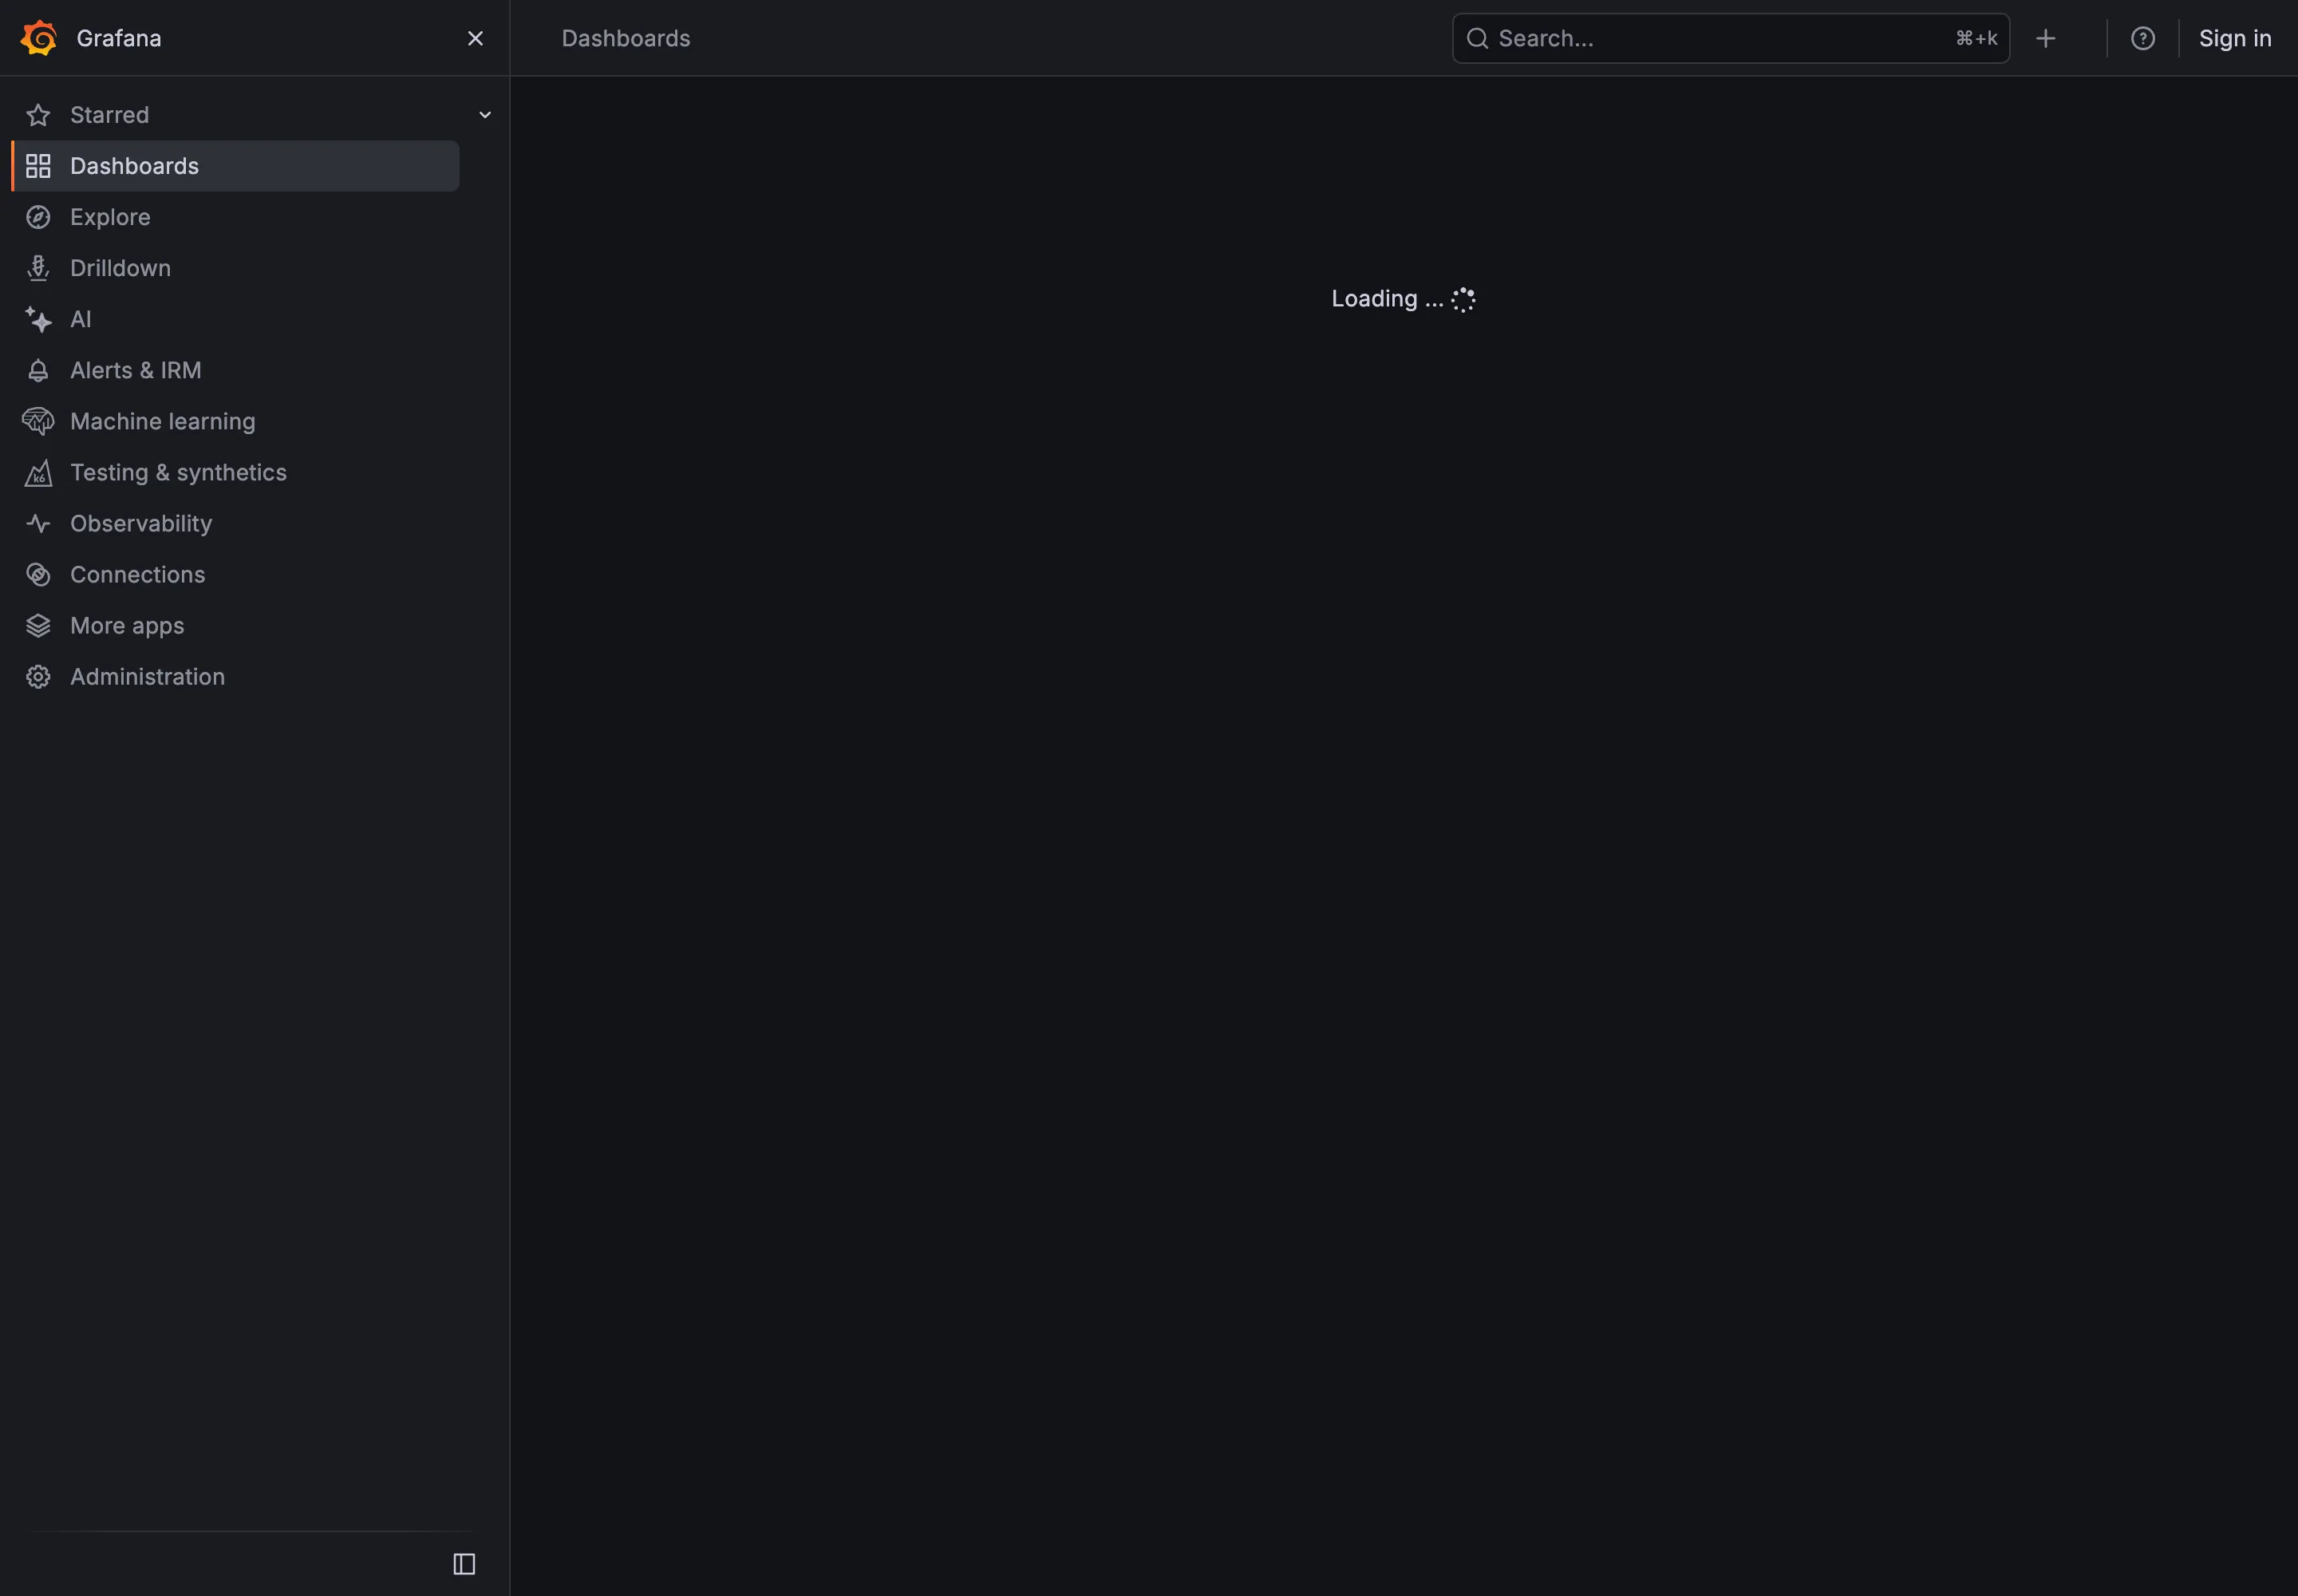
Grafana · Grafana SLO / SLO Overview, loading September 11, 2026 Grafana Play (signed out; captured 1.2s after navigation) sparse · dark · desktop-web
The same SLO Overview as the other Grafana capture, 1.2 seconds after navigation. This is the whole loading state: the nav rail, and the words "Loading …" centred in an otherwise empty canvas. No skeleton, no panel frames, nothing occupying the space the twenty-eight rows are about to take. I tried to catch an intermediate frame and there isn't one—at 3.5 seconds the page is complete. It goes from nothing to everything, so the layout arrives all at once and anything a viewer had started reading moves. The entry asks for three things here and this delivers one. It is distinguishable from broken and from empty, because a spinner clearly means working. It does not occupy the final space. And whether it fails into an error state rather than spinning forever is not something a screenshot can answer, which is its own small argument for showing the shape of what is coming.
  • Loading and skeleton state A spinner and the word Loading. Correct that work is happening, silent about what is arriving or how much.
  • Loading and skeleton state The space twenty-eight rows are about to fill, holding nothing. When they land, everything below them moves.
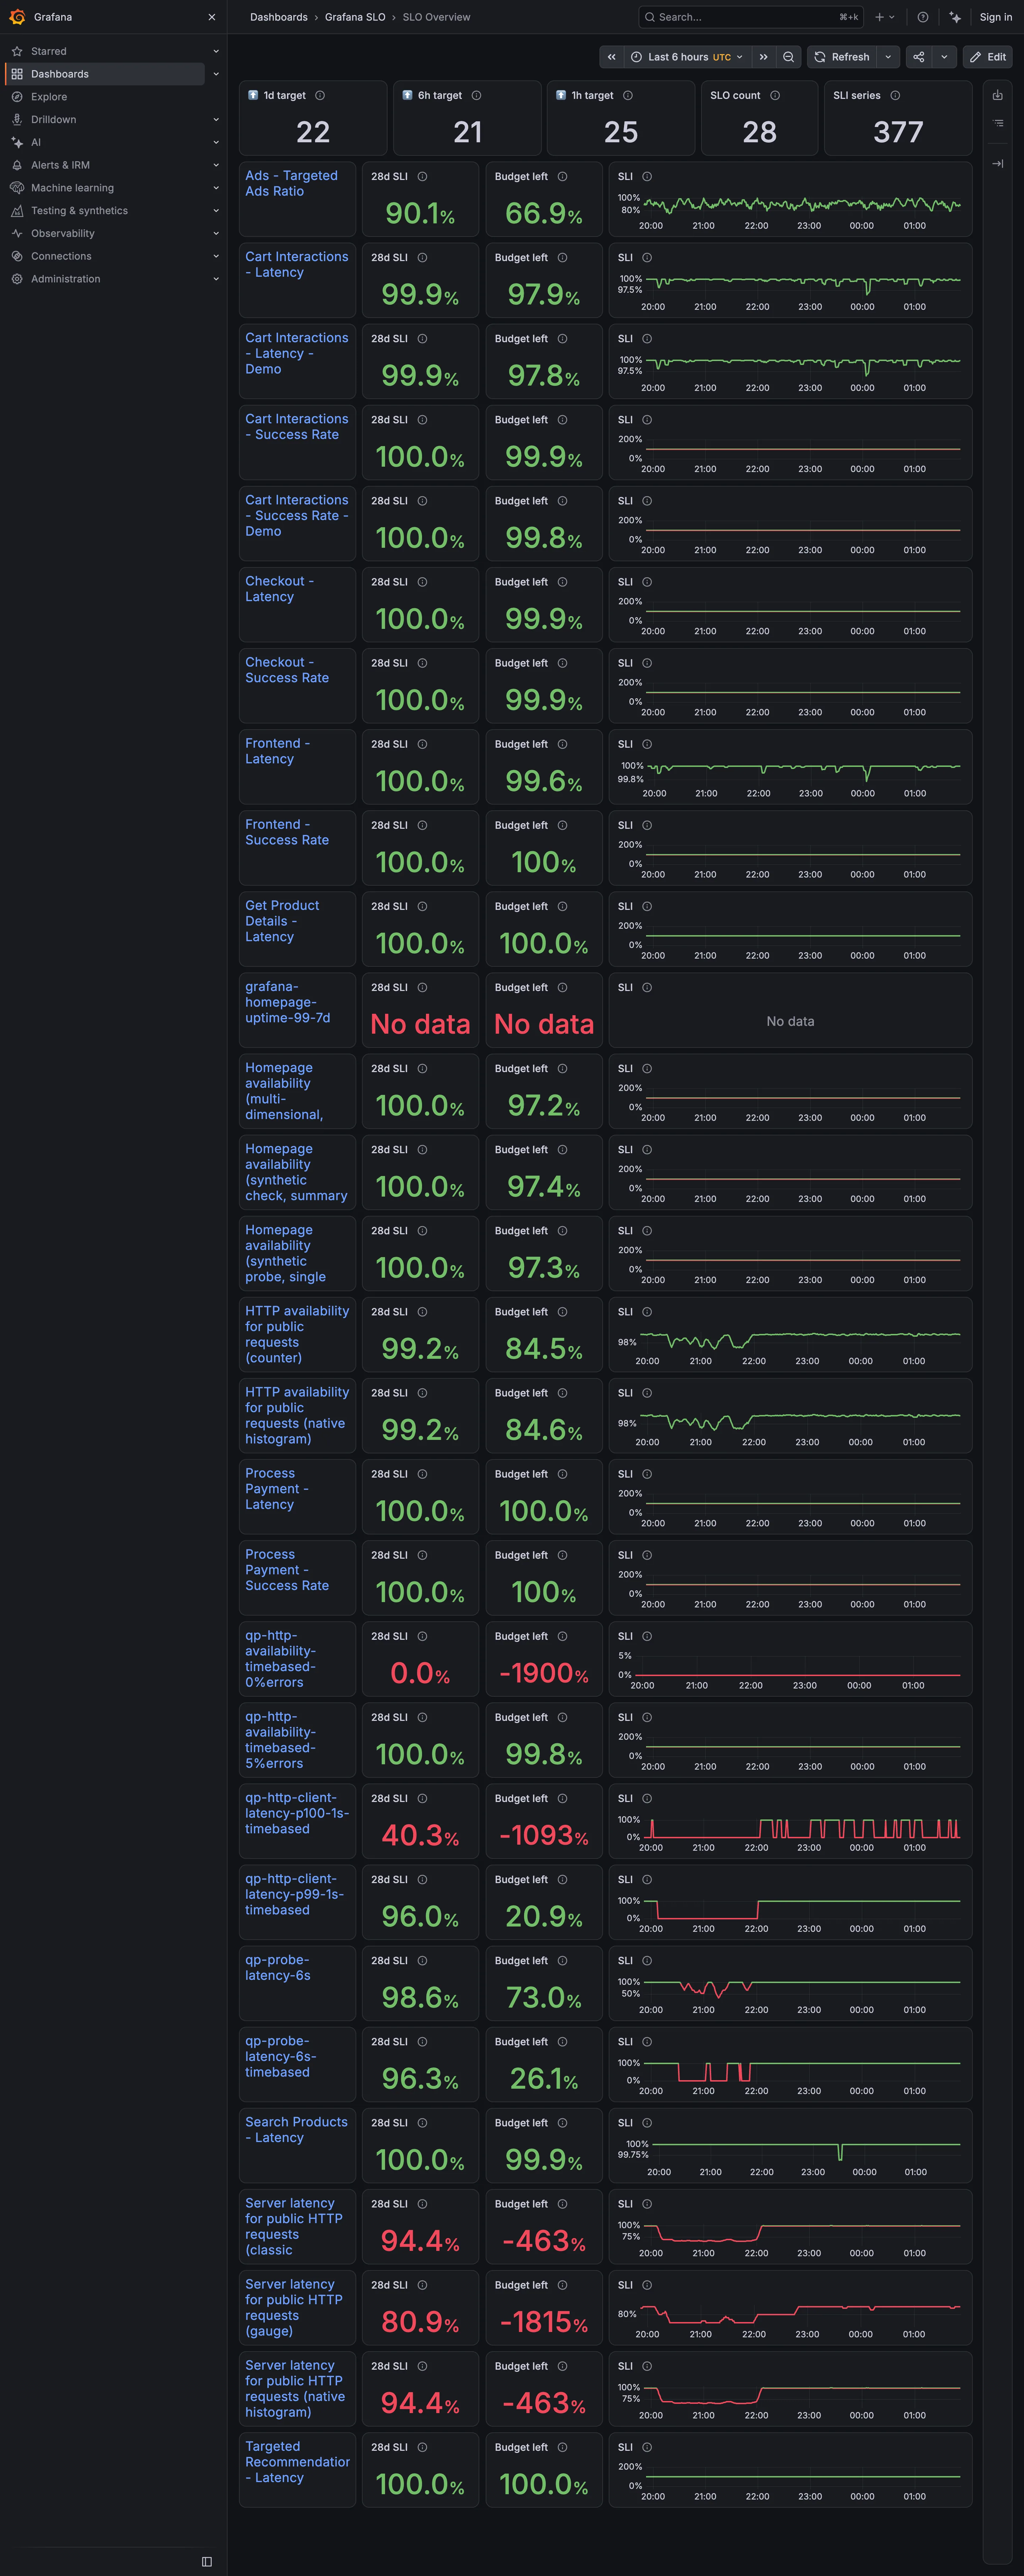
Grafana · Grafana SLO / SLO Overview September 10, 2026 Grafana Play (signed out; no version string exposed) dense · dark · desktop-web
Twenty-eight objectives, each a row carrying a 28-day indicator, the budget remaining, and a sparkline. The budget column is where it comes apart. Four rows read −1900%, −1815%, −1093% and −463%. A budget is the amount of failure an objective permits, so it bottoms out at −100% and everything past that is the display reporting how wrong the target was rather than how broken the service is. Those four sit in the same column, in the same type, as a row reading 99.8%. Two rows above them an objective reports "No data" in the same red, which is a third thing again and looks like the second. Meanwhile eleven rows sit at exactly 100.0% with a full budget—objectives that cannot fire. The sparkline column is scaled per row, so one row's axis runs 0 to 200% and its neighbour's runs 96 to 100, and the shapes are not comparable down the page even though the layout invites exactly that.
  • Metric targets The budget column: the derived quantity that turns a target from a binary into a rate.
  • Target and progress Budget left, −1900%. Past −100% the number is measuring the objective, not the service.
  • Error and stale state No data, in the same red as a breach. A third state wearing the second one's colour.
  • Small multiples A column of sparklines, each on its own axis. One runs 0–200%, the next 96–100%.
  • Header KPI strip Five tiles counting targets, objectives and series. None of them says whether any of it is met.