Skip to content
KONIGI

Dashboards / Product mechanics / Metric targets

9 of 10

Metric targets

The viewer wants the dashboard to know what 'good' is.

Updated September 10, 2026

Problem

Latency is 340ms. Whether that is fine depends on a number that currently lives in someone’s head, in a slide from last quarter, or in a threshold field on a panel nobody has opened since it was created.

Solution

Make the target a first-class object. Something with a value, an owner, a review date and a definition of the metric it applies to, referenced by every panel and alert that needs it rather than retyped into each.

The distinction from a threshold is where most of the value is. A threshold is a number on a panel. A target is a commitment with provenance: who set it, when, against what, and what happens when it is missed. Panels reference it; they do not own it.

The SRE framing is the most developed version and worth borrowing wholesale. An SLO is a target for a service level indicator, and the derived quantity—error budget, the amount of failure the objective permits—turns out to be far more useful than the target itself. A budget converts a binary into a rate: not “are we meeting it” but “how fast are we spending the allowance, and will it last the quarter”. That reframing is what makes a target actionable on a Tuesday rather than only at a quarter boundary.

Three properties separate a target that works from a number in a config file.

Ownership. A target with no name attached cannot be revised, only ignored.

A review date. Traffic grows, systems change, and an unreviewed target is wrong within a year and still colouring panels.

Reachability. The target should be visible where the metric is, and its definition reachable from there. A goal nobody can find the reasoning for gets treated as arbitrary, and arbitrary targets get gamed or dismissed.

Few’s bullet graph is the display counterpart: it exists precisely to show a measure against a target and qualitative ranges in one compact strip, which is what a target-aware panel should look like.

Use when

Someone has genuinely committed to a number, the commitment has consequences, and multiple surfaces need to agree about it.

Don’t use when

The number is aspirational or nobody owns it. A target nobody is accountable for teaches viewers that targets on this dashboard are decorative, and that lesson transfers to the ones that matter.

Trade-offs

Targets create incentive, and incentive creates gaming: the metric improves and the thing it was standing in for does not. They also age badly and rarely have a process for revision, so a display can be confidently red against a goal set for a system that no longer exists. Making targets first-class is real product work—storage, permissions, history, versioning—which is why most tools leave them as per-panel thresholds. And a single target flattens a distribution: hitting a p95 target while the p99 doubles is a pass that hides a real deterioration.

Checklist

  • Who owns this target, and do they know?
  • When was it last reviewed, and when is it next due?
  • Is the metric definition it applies to unambiguous and reachable?
  • Is the target stored once and referenced, or retyped per panel?
  • Does the display show distance to target, not only current value?
  • Is there a budget or rate framing, or only a pass/fail?
  • What happens when it is missed—does anything at all change?
  • Could this target be met while the underlying goal is not?
  • Does the alert that fires use the same number the panel draws?
  • Is the history of the target visible, so a change is not silent?

Compare

Honeycomb treats SLOs as objects with budget burn as the primary display, which is the fullest expression of the pattern and the one that answers “should I act now” rather than only “am I over”. Grafana has no target concept: goals live as per-panel thresholds, so the same objective is retyped across dashboards and drifts independently in each. Datadog offers SLOs as first-class entities with their own status and history, so a target has a page rather than a field. Looker and BI tools generally push targets into the modelling layer, which makes them consistent everywhere and makes changing one an engineering task rather than a product decision.

Target and progress is the display half, and covers the bullet graph properly. Threshold line is what a target usually degrades into when nobody owns it. Alert rule is what should reference the target rather than carry its own copy of the number. Explain this metric matters more here than anywhere, since a target on an ambiguous metric is an argument waiting to happen. KPI tile is where a target most often should appear and usually doesn’t.
Metric targets anatomy A target as an object with a value, an owner, a review date and a definition, referenced by two panels and an alert rather than retyped into each. Beside it the derived quantity that makes it useful on a Tuesday: the error budget, drawn as a burn-down against the quarter. A commitment, not a number on a panel Checkout availability objective 99.9% of requests measured as non-5xx / total, 28d owner payments reviewed due in 3 weeks availability panel the wallboard tile the paging rule 1 2 Error budget 38% left, 41 days to go burning faster than the quarter allows 3 1 OWNER AND REVIEW DATE A target with no name attached can't be revised, only ignored. An unreviewed one is wrong within a year and still colouring panels. 2 PANELS REFERENCE IT They don't own it. A threshold is a number on a panel; a target is a commitment with provenance, and one copy of it. 3 THE BUDGET BEATS THE TARGET It converts a binary into a rate. Not "are we meeting it" but "how fast are we spending the allowance, and will it last the quarter". Which is what makes a target actionable on a Tuesday rather than at a quarter boundary.
Wireframe — the pattern's anatomy, not any one product's version of it

Implementation

This is the dashboard knowing what good is. A target turns a number into a judgement, which means the target needs an owner and a date on it or nobody can say whether missing it matters.

shadcn
npx shadcn@latest add card progress
Tokens
--background--card--card-foreground--muted--muted-foreground--border--status-warn--status-critical--chart-1

Checkout availability

objective
99.9% of requests
measured as
non-5xx / total, 28d
owner
payments
reviewed
due in 3 weeks

used by

Error budget

38%

left, 41 days to go

burning faster than the quarter allows

MetricTarget.tsxTarget is a type with owner, review date and definition as required fields. TargetCard shows it; ErrorBudget derives the burn from it.

import { Card } from "@/components/ui/card";
import { Progress } from "@/components/ui/progress";

/**
 * A target is a commitment with provenance, and the provenance is the type.
 * Owner and review date are required because a target with no name cannot
 * be revised, only ignored, and an unreviewed one is wrong within a year and
 * still colouring panels. Panels take a Target; they never retype the number.
 */
export type Target = {
  name: string;
  /** The objective, as a fraction: 0.999 for 99.9%. */
  objective: number;
  /** What the objective is a fraction of: "requests", "checkouts". */
  of: string;
  /** How the indicator is computed, so the reasoning is reachable from the panel. */
  measuredAs: string;
  owner: string;
  reviewDue: Date;
  /** What draws or fires on this target. Stored once, referenced from here. */
  referencedBy: string[];
};

const DAY = 86_400_000;
const pct = (f: number) => `${+(f * 100).toFixed(2)}%`;

function review(due: Date, now: Date) {
  const days = Math.ceil((due.getTime() - now.getTime()) / DAY);
  if (days < 0) return { text: `overdue by ${-days} days`, cls: "text-status-critical" };
  const text = days >= 14 ? `due in ${Math.round(days / 7)} weeks` : `due in ${days} days`;
  return { text, cls: days <= 30 ? "text-status-warn" : "text-card-foreground" };
}

export function TargetCard({ target, now, onOpen }: { target: Target; now: Date; onOpen?: (t: Target) => void }) {
  const r = review(target.reviewDue, now);
  return (
    <Card className="p-4">
      <p className="border-b pb-2 text-[11px] uppercase tracking-wide text-muted-foreground">{target.name}</p>
      <dl className="mt-3 grid grid-cols-[84px_1fr] gap-x-3 gap-y-2.5 text-xs">
        <dt className="text-muted-foreground">objective</dt><dd className="m-0 tabular-nums text-card-foreground">{pct(target.objective)} of {target.of}</dd>
        <dt className="text-muted-foreground">measured as</dt><dd className="m-0 text-card-foreground">{target.measuredAs}</dd>
        <dt className="text-muted-foreground">owner</dt><dd className="m-0 text-card-foreground">{target.owner}</dd>
        <dt className="text-muted-foreground">reviewed</dt><dd className={`m-0 ${r.cls}`}>{r.text}</dd>
      </dl>
      <p className="mt-3 border-t pt-2 text-[11px] text-muted-foreground">used by</p>
      <ul className="mt-1 flex flex-wrap gap-1.5 text-[11px]">
        {target.referencedBy.map((ref) => (
          <li key={ref}>
            <button type="button" onClick={onOpen && (() => onOpen(target))} className="rounded-[2px] border px-2 py-0.5 text-card-foreground">{ref}</button>
          </li>
        ))}
      </ul>
    </Card>
  );
}

/**
 * The budget is what makes the target usable on a Tuesday. It converts the
 * pass/fail into a rate: how much of the permitted failure is spent, against
 * how much of the period has elapsed.
 */
export function budget(target: Target, period: { start: Date; end: Date }, errors: number, total: number, now: Date) {
  const allowed = (1 - target.objective) * total;
  const left = Math.max(0, 1 - errors / allowed);
  const elapsed = (now.getTime() - period.start.getTime()) / (period.end.getTime() - period.start.getTime());
  const daysToGo = Math.ceil((period.end.getTime() - now.getTime()) / DAY);
  return { left, expectedLeft: 1 - elapsed, daysToGo, fast: left < 1 - elapsed };
}

export function ErrorBudget({ target, period, errors, total, now }: {
  target: Target;
  /** The period the budget is spread over, usually the quarter. */
  period: { start: Date; end: Date };
  errors: number;
  total: number;
  now: Date;
}) {
  const b = budget(target, period, errors, total, now);
  return (
    <Card className="bg-muted p-4">
      <p className="border-b pb-2 text-[11px] uppercase tracking-wide text-muted-foreground">Error budget</p>
      <p className="mt-3 text-3xl font-medium tabular-nums text-card-foreground">{Math.round(b.left * 100)}%</p>
      <p className="text-[11px] tabular-nums text-muted-foreground">left, {b.daysToGo} days to go</p>
      <div className="relative mt-3">
        <Progress value={b.left * 100} aria-label="error budget left" className="h-3 rounded-[2px] bg-background [&>div]:bg-chart-1" />
        {/* Where the budget would be if it were spent evenly over the period. */}
        <span aria-hidden="true" className="absolute -top-1 h-5 w-px bg-status-warn" style={{ left: `${b.expectedLeft * 100}%` }} />
      </div>
      <p className={`mt-2 text-[11px] ${b.fast ? "text-status-warn" : "text-muted-foreground"}`}>
        {b.fast ? "burning faster than the quarter allows" : "on pace for the quarter"}
      </p>
    </Card>
  );
}

demo.tsxHow it is called: one target object, the card that names it and the budget computed from it against the quarter.

import { ErrorBudget, TargetCard, type Target } from "./MetricTarget";

/**
 * One target, stored once, drawn twice: the card that names it and the
 * budget derived from it. Fifty days into the quarter, 62% of the permitted
 * failures are spent, so the budget is burning faster than the period allows.
 */
const NOW = new Date("2026-08-20T09:00:00Z");
const Q3 = { start: new Date("2026-07-01T00:00:00Z"), end: new Date("2026-09-30T00:00:00Z") };

const AVAILABILITY: Target = {
  name: "Checkout availability",
  objective: 0.999,
  of: "requests",
  measuredAs: "non-5xx / total, 28d",
  owner: "payments",
  reviewDue: new Date("2026-09-10T00:00:00Z"),
  referencedBy: ["availability panel", "the wallboard tile", "the paging rule"],
};

export default function Demo() {
  return (
    <div className="grid grid-cols-[1.4fr_1fr] gap-5">
      <TargetCard target={AVAILABILITY} now={NOW} onOpen={(t) => console.log("open", t.name)} />
      <ErrorBudget target={AVAILABILITY} period={Q3} errors={25_544} total={41_200_000} now={NOW} />
    </div>
  );
}
What it renders. Identical markup in both panes, with only the token values changing.

Examples

Captures whose hotspots reference this pattern, grouped by product and dated. The dashed boxes are this pattern; hover any box for the note.

Grafana

The reference implementation for panel grids, template variables, and stat panels; most other tools are defined by how they differ from it.

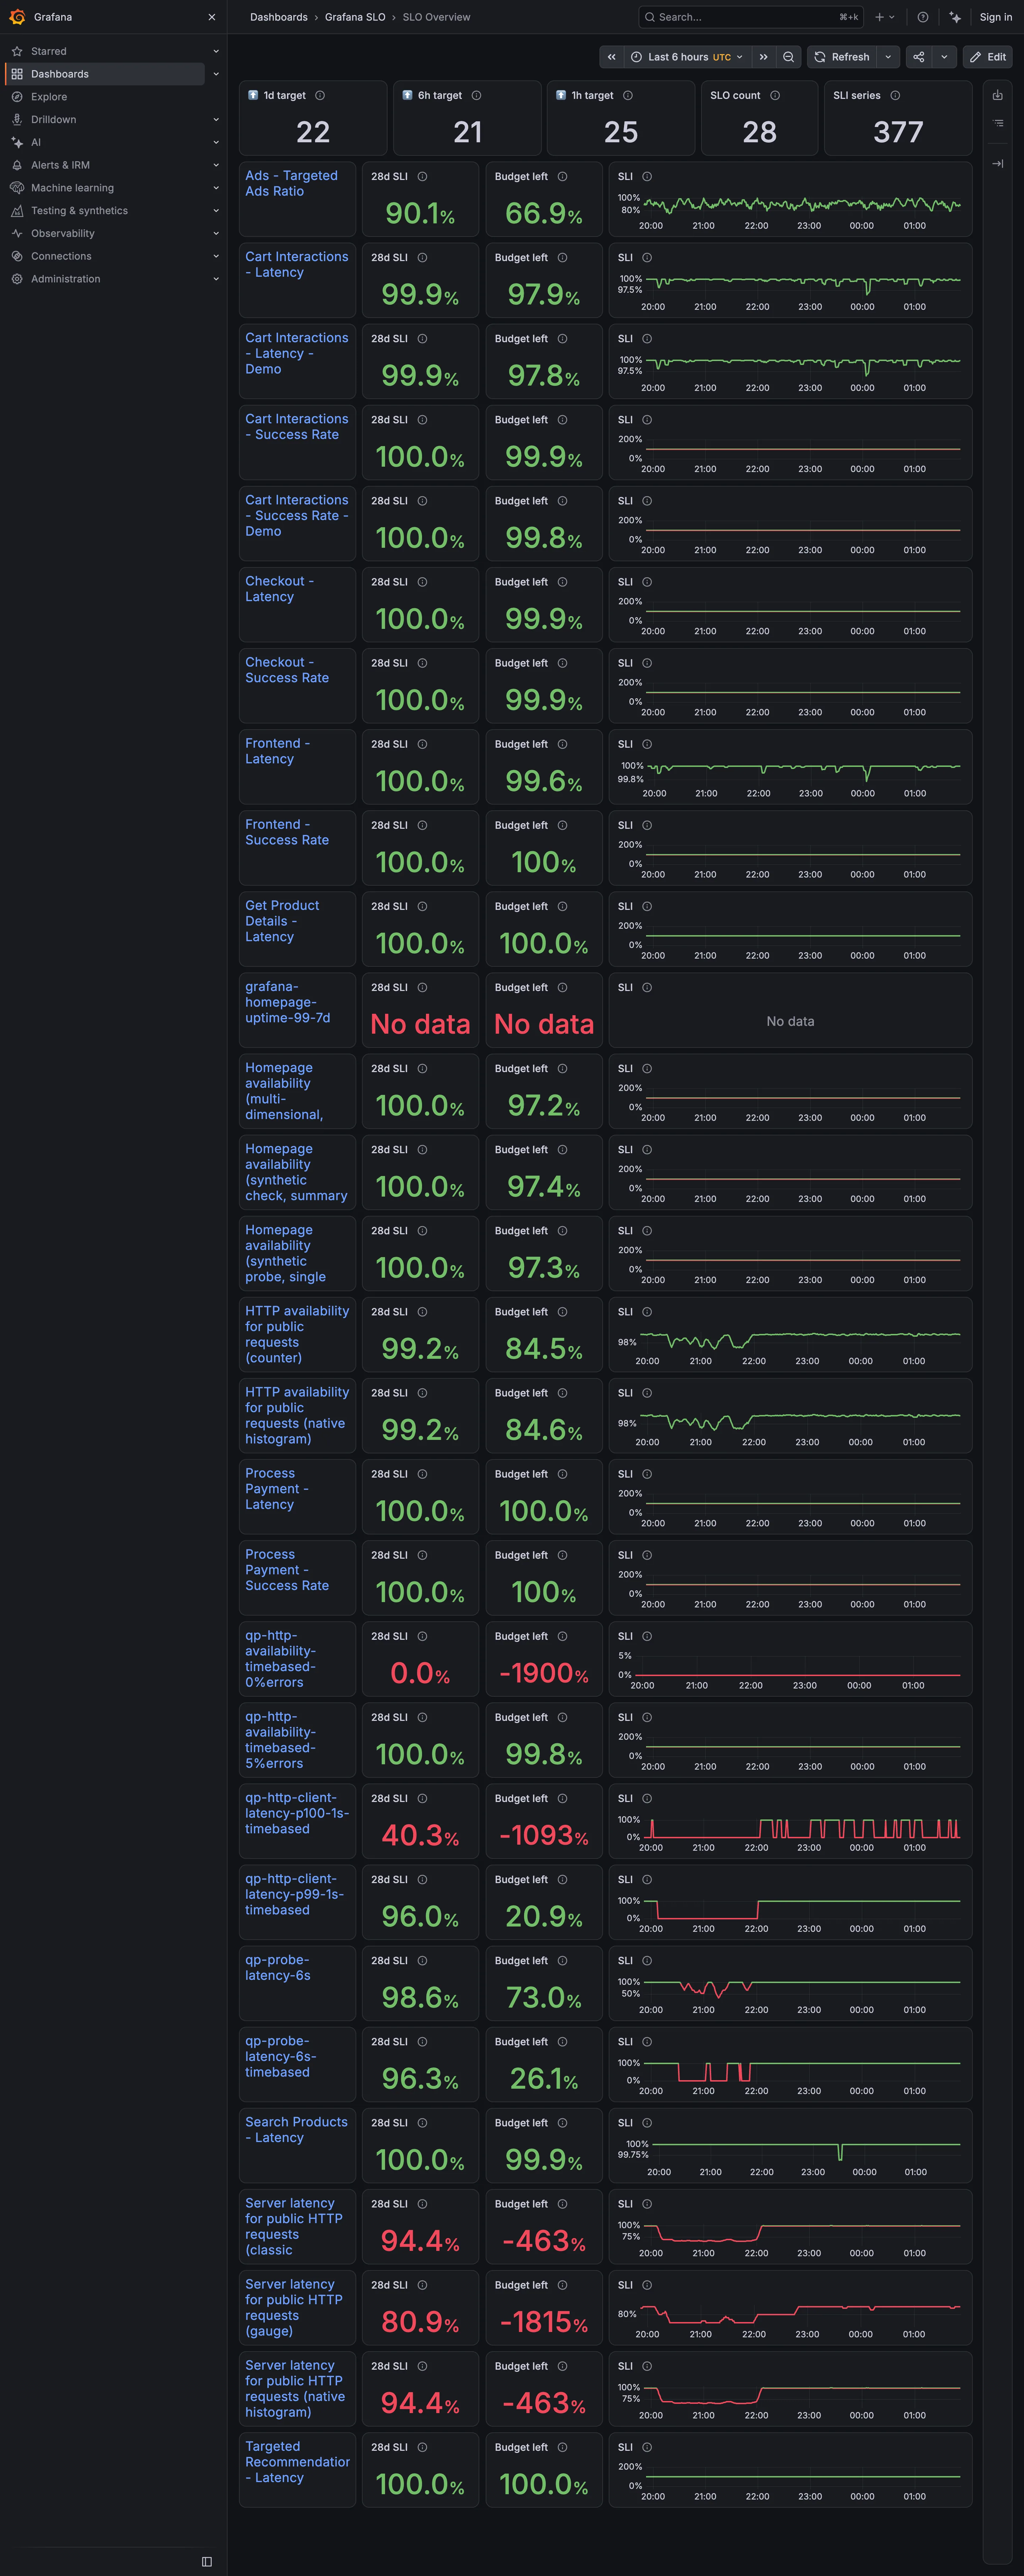
Grafana SLO / SLO Overview September 10, 2026 Grafana Play (signed out; no version string exposed) dense · dark · desktop-web
Twenty-eight objectives, each a row carrying a 28-day indicator, the budget remaining, and a sparkline. The budget column is where it comes apart. Four rows read −1900%, −1815%, −1093% and −463%. A budget is the amount of failure an objective permits, so it bottoms out at −100% and everything past that is the display reporting how wrong the target was rather than how broken the service is. Those four sit in the same column, in the same type, as a row reading 99.8%. Two rows above them an objective reports "No data" in the same red, which is a third thing again and looks like the second. Meanwhile eleven rows sit at exactly 100.0% with a full budget—objectives that cannot fire. The sparkline column is scaled per row, so one row's axis runs 0 to 200% and its neighbour's runs 96 to 100, and the shapes are not comparable down the page even though the layout invites exactly that.
  • Metric targets The budget column: the derived quantity that turns a target from a binary into a rate.
  • Target and progress Budget left, −1900%. Past −100% the number is measuring the objective, not the service.
  • Error and stale state No data, in the same red as a breach. A third state wearing the second one's colour.
  • Small multiples A column of sparklines, each on its own axis. One runs 0–200%, the next 96–100%.
  • Header KPI strip Five tiles counting targets, objectives and series. None of them says whether any of it is met.