Problem
The deploy went out ninety seconds ago and something is wrong. Aggregates are five minutes behind and averaged into uselessness. The person watching needs the actual events, now, in order.
Solution
A stream of raw lines, newest arriving live, with enough structure layered on that a human can survive the volume. The ancestor is tail -f and the pattern has never really improved on its core promise: no aggregation, no delay, just what happened.
Everything interesting is in what gets added on top without breaking that promise.
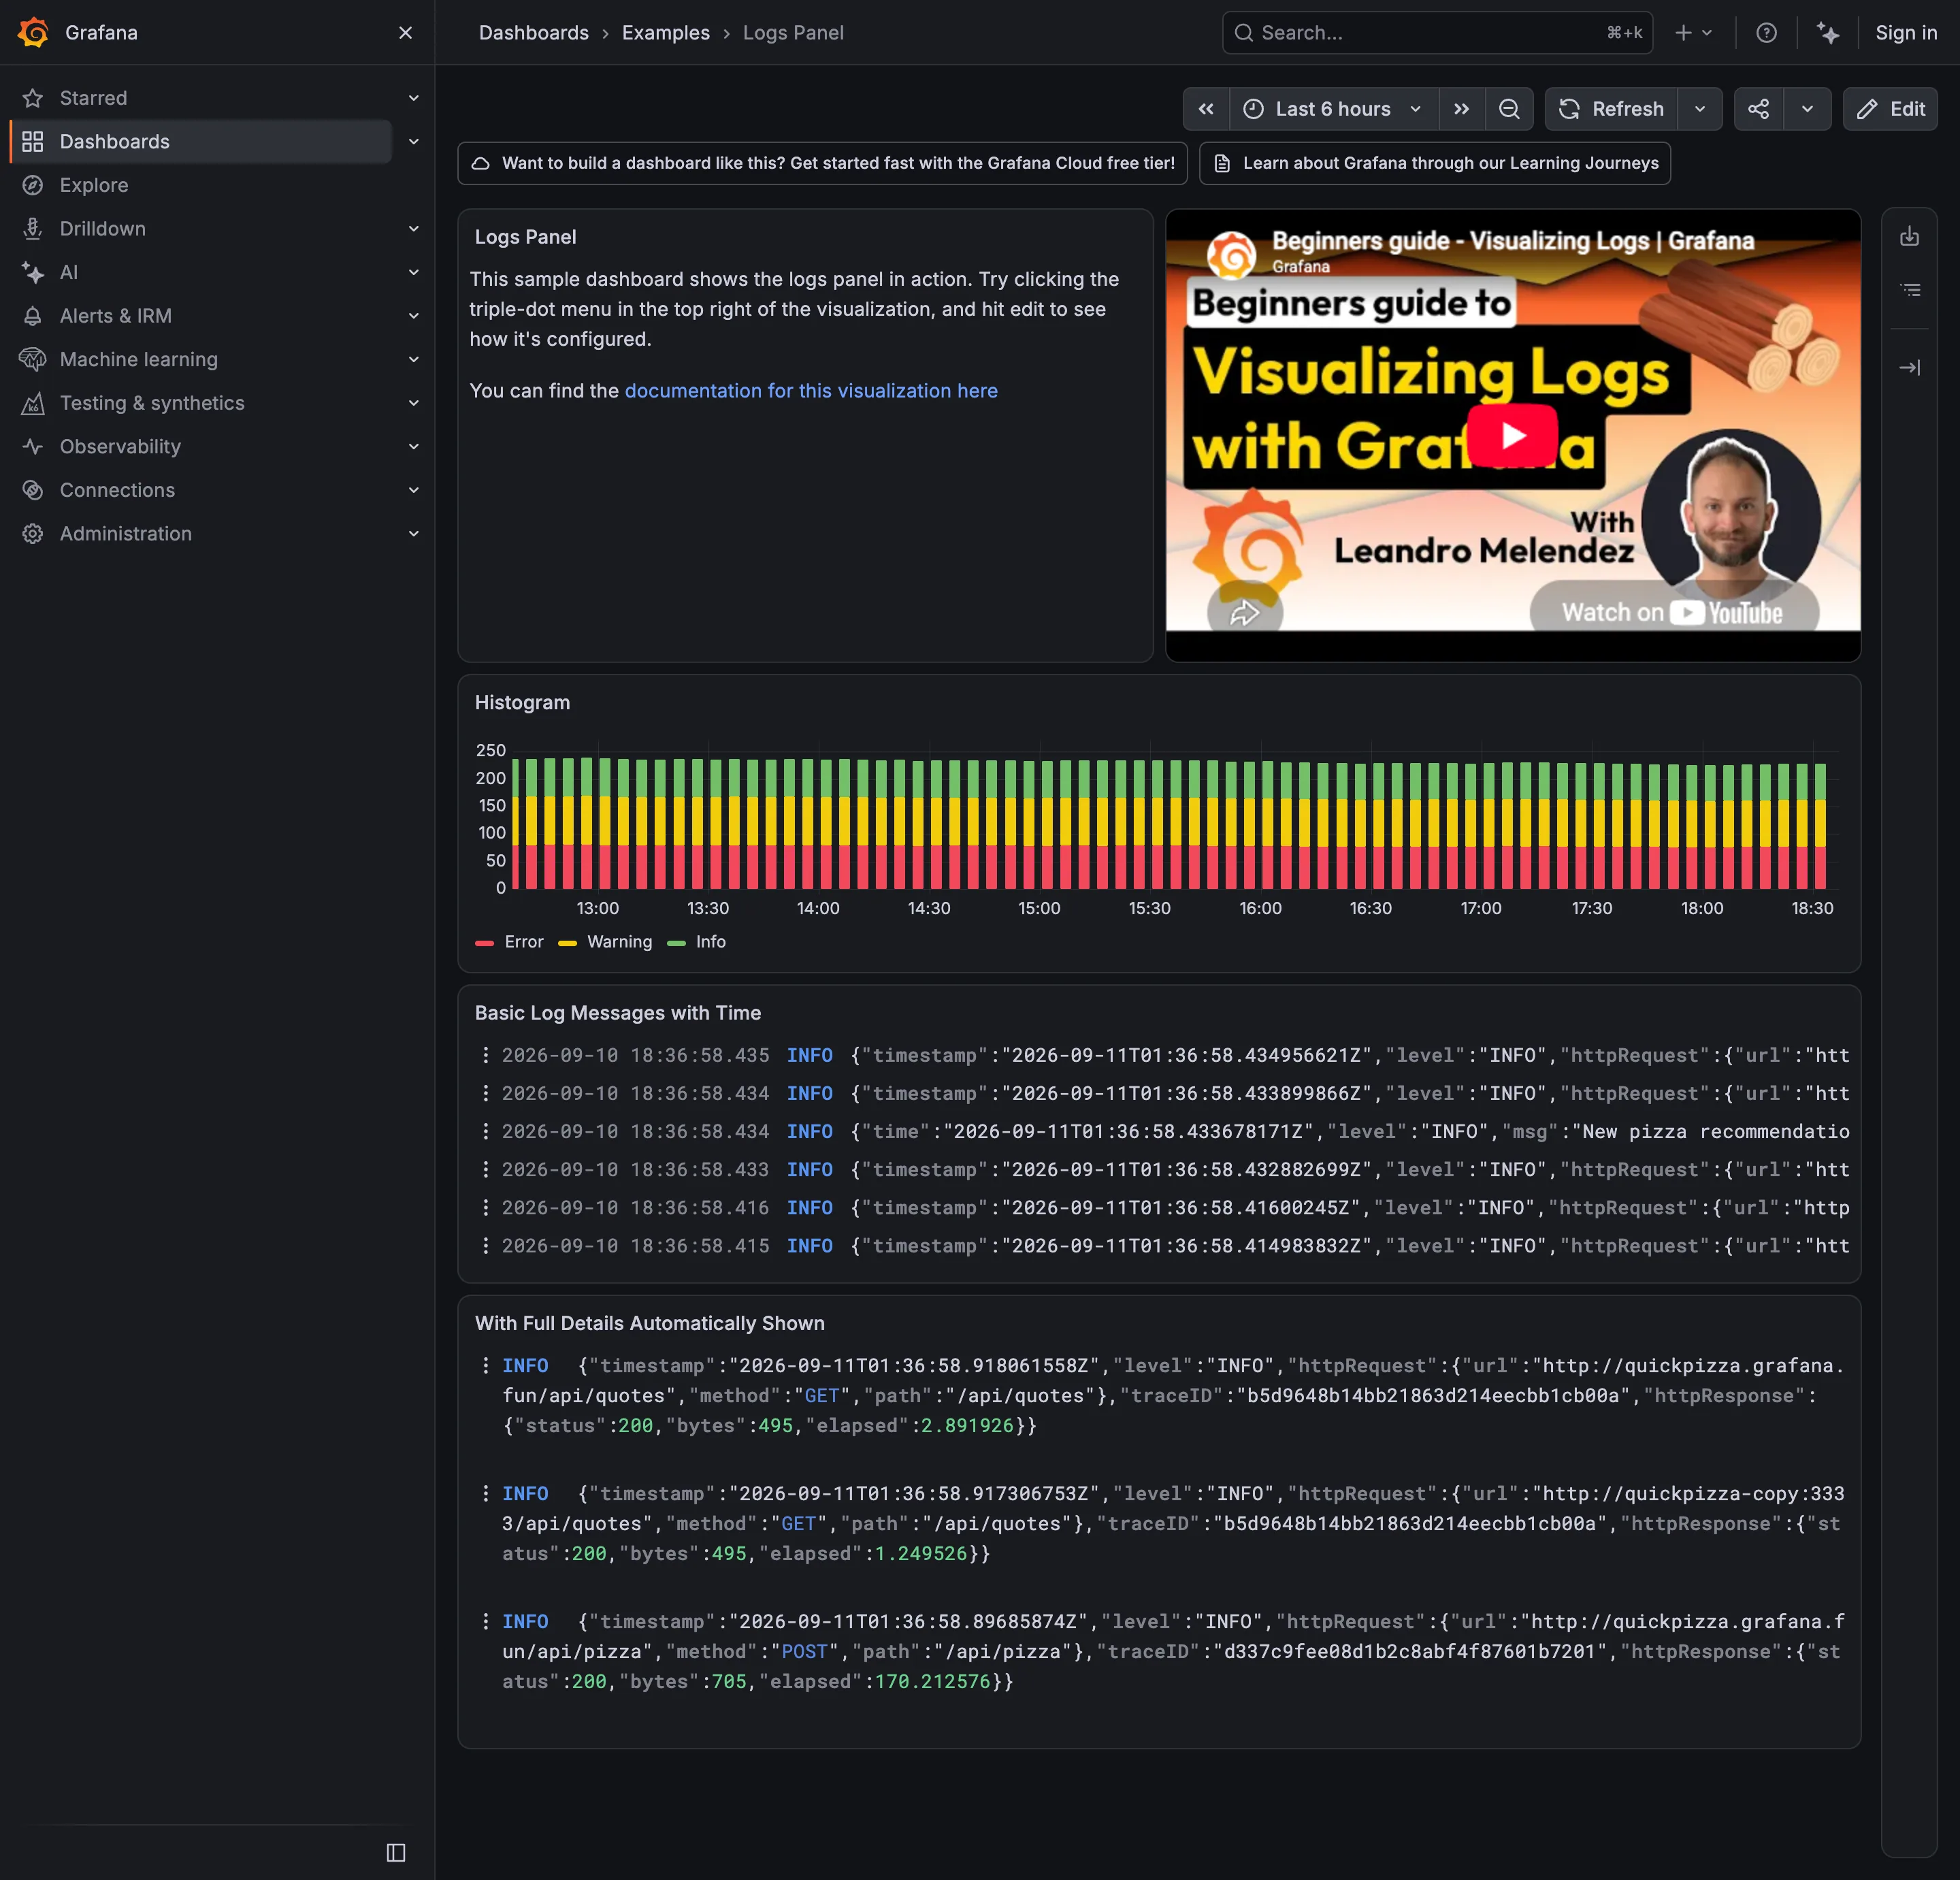
Grafana’s Explore is a good inventory of the necessary additions. Live tail streams new lines, and the detail that makes it usable is that new logs appear at the bottom with a contrasting background so the eye can track what is new against what was already there. Log level colouring recognises seven levels—critical, error, warning, info, debug, trace, unknown—from a level label, which turns a wall of monospace into something scannable. Deduplication offers None, Exact (matching whole lines, dates excluded), Numbers (ignoring numeric values) and Signature, the most aggressive. That last set matters more than it sounds: a retry loop emitting the same line four hundred times will otherwise flush every other event off the screen in seconds.
The other necessary addition is a way out. A log line is evidence, and evidence is only useful attached to a request. Explore correlates logs with metrics, traces and profiles side by side, and carries compatible labels across when you switch data source. A tail without a route to the trace ID is a wall of text you have to leave in order to use.
Use when
Something is happening right now, the aggregate view has already told you roughly where, and you need the specifics. Deploys, incidents, and reproducing a bug against a known request.
Don’t use when
The question is about frequency or trend. Watching a tail to judge how often something happens is a way to be badly wrong with high confidence; count it instead. And never as a monitoring surface, because a stream nobody is watching is not monitoring.
Trade-offs
Live tail is the only pattern here that punishes the viewer for looking away, and past a few hundred lines a minute it is unreadable by construction. Auto-scroll fights with the reader: pause and you fall behind, don’t pause and you cannot read anything long enough to understand it. Retention is expensive, so the window you can tail is usually much shorter than the window you can aggregate. And the tail is deceptively persuasive—a vivid error scrolling past feels like the cause, and is often a downstream symptom that started later than whatever actually broke.
Checklist
- Is new content visually distinct from what was already on screen?
- What happens above a few hundred lines a second, and does the UI say it is dropping?
- Can the viewer pause without losing the buffer, and resume without losing their place?
- Is there level colouring, and does it come from a real field rather than a regex on the text?
- Is deduplication available, and does the viewer know it is on?
- Can a line lead to the trace, the host, and the deploy?
- Is the timestamp shown in a stated timezone, and does it match the charts nearby?
- Can the viewer filter without leaving the stream and losing the tail?
- How far back does the tail buffer go before it becomes a search instead?
- Does a stalled stream look different from a quiet one?
Compare
Grafana Explore treats the tail as one signal among several and invests in the crossings: contrasting backgrounds for new lines, level colouring from a label, four deduplication modes, and label continuity when switching to metrics or traces. Honeycomb rejects the line-oriented framing, treating a log as a wide structured event so that what would be tailing becomes querying, which is better for questions and worse for the case where you genuinely do not yet know what to ask. Sentry never shows a raw stream at all; events are grouped into issues on arrival, which is the right default for errors and hides exactly the low-level noise a tail exists to surface. Netdata keeps a systemd journal view per node, so the tail is scoped to a machine you already suspect rather than to the estate.
Related
Trace waterfall is where a promising log line should lead. Filter bar is what makes a high-volume stream survivable. Search across panels is the same need at rest rather than live. Freshness indicator answers whether a quiet stream is quiet or broken. Error and stale state is what a stalled tail should be showing instead of nothing.