Skip to content
KONIGI

Dashboards / Interaction / Drill-down

3 of 8

Drill-down

The overview shows that something is wrong; the viewer needs to get to what, in one click.

Updated September 10, 2026

Problem

The overview shows error rate climbing. The viewer now needs the specific service, the specific endpoint, and eventually the specific request, and at every step they must not lose the time range, the filters, or their place.

Solution

Make every aggregate a doorway. A bar, a row, a cell, a node: clicking it opens the narrower view of the same thing, already scoped.

Shneiderman’s mantra names this as one of the seven tasks and puts it in sequence: overview first, zoom and filter, then details on demand. Drill-down is the transition between those stages, and it is judged almost entirely on how much context survives the jump.

Grafana’s data links show what “carrying context” concretely requires. A link can interpolate __url_time_range for the dashboard’s current window, __from and __to, __series.name, __field.name and __field.labels.<LABEL>, and the value under the cursor as __value.raw, __value.numeric, __value.text or __value.time. That list is essentially an inventory of what the viewer had in their head at the moment they clicked. A drill-down that drops any of it makes them rebuild it by hand on arrival.

The most common failure is silent scope loss: clicking a spike on a chart filtered to one cluster lands on a page showing all clusters, at the default time range, and the number the viewer was chasing is no longer there. They usually assume they misread the first chart.

The second failure is the dead end. Somewhere down the chain there is a level with nothing below it, and if that level doesn’t say so, viewers keep clicking and start distrusting the whole path.

Use when

There is a genuine hierarchy—fleet to host, service to endpoint, issue to event—and the overview is a summary of things that individually exist somewhere.

Don’t use when

There is no level below. A click that reloads the same information in a modal teaches viewers that clicking does nothing. Also avoid it when the answer is better reached by filtering in place; jumping pages costs orientation that cross-filtering doesn’t.

Trade-offs

Every drill step is a context switch, and deep paths lose people. Back is the most-used control in this pattern and the most often broken, especially when the drill target is a different product. Links encode assumptions about the destination’s URL structure, so they rot quietly when the other page changes. And drill-downs create an implicit hierarchy that may not be the only sensible one: a path from service to host cannot answer a question that starts at the host.

Checklist

  • Does the time range survive the jump?
  • Do the active filters and template variables survive it?
  • Does the value or series the viewer clicked arrive as scope on the other side?
  • Is the target obviously the same thing, narrower—or does it look like a different page?
  • Is it visually clear what is clickable before the cursor is over it?
  • Does browser back return to the exact prior state, including scroll?
  • What happens at the bottom of the hierarchy, and does the last level say it is the last?
  • Does the destination handle an empty result, and does it say why?
  • Does it open in place or a new tab, and is that consistent across the dashboard?
  • Who owns the destination’s URL contract, and what happens when it changes?

Compare

Grafana makes the context explicit as interpolated variables, which is powerful and means a drill-down is only as good as the person who assembled the link string. Sentry builds the hierarchy into its object model—issue to event to trace to span—so drilling is navigation between things rather than between dashboards, and back always means something. Datadog ties panels to a scope inherited from the page, so a click carries tags rather than a hand-written URL, which rots less and constrains where you can go. Honeycomb largely replaces the pattern: rather than navigating to a narrower page you add a group-by or a filter to the query you already have, so there is no jump to lose context across.

Overview then detail is the structure this pattern moves through. Cross-filter is the alternative that narrows without navigating. Detail on demand is the in-place version for a single item. Trace waterfall is often the last stop on the path. Ranked list is the most common origin, because a rank position is a promise that the item exists.
Drill-down anatomy A bar being clicked on a chart scoped to one cluster over one hour, and the page it opens, which arrives carrying that cluster, that window, the series name and the value under the cursor. Beside it, the same click landing with none of it. What has to survive the click Errors · eu-west · 1h TimeoutError eu-west 14:00-15:00 4,182 1 2 All · 6h 3 1 EVERY AGGREGATE IS A DOOR A bar, a row, a cell, a node. Clicking opens the narrower view of the same thing, already scoped. 2 WHAT TRAVELS The window, the scope, the series name and the value under the cursor. That list is an inventory of what was in the viewer's head. 3 SILENT SCOPE LOSS Landing on all clusters at the default range. The number they were chasing isn't there, and they assume they misread the first chart. The other failure is the dead end: a level with nothing below it that doesn't say so.
Wireframe — the pattern's anatomy, not any one product's version of it

Implementation

Getting from the number that is wrong to the rows that made it wrong. The breadcrumb is the load-bearing part, because a reader three levels in has usually forgotten what the filter above them was.

shadcn
npx shadcn@latest add breadcrumb
Tokens
--card--card-foreground--accent--accent-foreground--muted-foreground--border--chart-1
eu-west14:00-15:004,182
  1. POST /checkout2,310
  2. GET /cart1,104
  3. POST /payments/authorize512
  4. GET /search256

Bottom of the hierarchy. Nothing here opens further.

DrillDown.tsxA tree walked by path. The scope and the clicked value travel as chips, the crumb goes back up, and the bottom level says it is the bottom.

import { Fragment, useState } from "react";
import {
  Breadcrumb, BreadcrumbItem, BreadcrumbLink, BreadcrumbList, BreadcrumbPage, BreadcrumbSeparator,
} from "@/components/ui/breadcrumb";
import { cn } from "@/lib/utils";

/** Every aggregate is a door. A node with children opens the narrower view
 *  of the same thing; a node without them is the bottom, and the level says so. */
export type Node = {
  name: string;
  value: number;
  children?: Node[];
};

/** What has to survive the click. The window and the cluster travel with
 *  every level, and the value under the cursor arrives as a chip. */
export type Scope = { cluster: string; from: Date; to: Date };

type Props = {
  root: Node;
  scope: Scope;
  /** Names from the root down to the level to open on. Put it in the URL, so
   *  back returns to the exact prior state. */
  defaultPath?: string[];
  onNavigate?: (path: string[]) => void;
};

const hhmm = (d: Date) => d.toLocaleTimeString("en-GB", { hour: "2-digit", minute: "2-digit", timeZone: "UTC" });
const span = (s: Scope) => `${Math.round((s.to.getTime() - s.from.getTime()) / 3_600_000)}h`;
const n = (v: number) => v.toLocaleString("en-US");

export function DrillDown({ root, scope, defaultPath = [], onNavigate }: Props) {
  const [path, setPath] = useState(defaultPath);
  const go = (next: string[]) => { setPath(next); onNavigate?.(next); };

  // Walk the path to the current node, keeping every ancestor for the crumbs.
  const trail = path.reduce<Node[]>((acc, name) => {
    const child = acc[acc.length - 1].children?.find((c) => c.name === name);
    return child ? [...acc, child] : acc;
  }, [root]);
  const here = trail[trail.length - 1];
  const rows = here.children ?? [];
  const max = Math.max(...rows.map((r) => r.value), 1);
  const bottom = rows.every((r) => !r.children);
  const rootLabel = `${root.name} · ${scope.cluster} · ${span(scope)}`;

  return (
    <div className="rounded-lg border bg-card p-4">
      <Breadcrumb>
        <BreadcrumbList className="text-[11px]">
          {trail.map((node, i) => {
            const last = i === trail.length - 1;
            const label = i === 0 ? rootLabel : node.name;
            return (
              <Fragment key={node.name}>
                <BreadcrumbItem>
                  {last ? (
                    <BreadcrumbPage className="uppercase tracking-wide">{label}</BreadcrumbPage>
                  ) : (
                    <BreadcrumbLink asChild>
                      <button type="button" className="uppercase tracking-wide" onClick={() => go(path.slice(0, i))}>{label}</button>
                    </BreadcrumbLink>
                  )}
                </BreadcrumbItem>
                {!last && <BreadcrumbSeparator />}
              </Fragment>
            );
          })}
        </BreadcrumbList>
      </Breadcrumb>

      {/* The scope arrived with the click. Cluster, window, and the number the
          viewer was chasing, so it is visibly still here. */}
      <div className="mt-3 flex flex-wrap gap-2 border-t pt-3">
        {[scope.cluster, `${hhmm(scope.from)}-${hhmm(scope.to)}`, n(here.value)].map((chip) => (
          <span key={chip} className="rounded-md border border-chart-1 bg-chart-1/10 px-2 py-0.5 text-[10px] tabular-nums text-card-foreground">{chip}</span>
        ))}
      </div>

      <ol className="mt-3 space-y-1.5">
        {rows.map((r) => {
          const door = !!r.children;
          const Tag = door ? "button" : "div";
          return (
            <li key={r.name}>
              <Tag
                type={door ? "button" : undefined}
                onClick={door ? () => go([...path, r.name]) : undefined}
                className={cn("grid w-full grid-cols-[minmax(0,1fr)_120px_56px] items-center gap-3 rounded px-1 py-0.5 text-left text-xs",
                  door && "hover:bg-accent hover:text-accent-foreground")}
              >
                <span className={cn("truncate", door && "underline decoration-border underline-offset-2")}>{r.name}</span>
                <span className="h-2 rounded-[1px] bg-chart-1" style={{ width: `${(r.value / max) * 100}%` }} />
                <span className="text-right tabular-nums text-muted-foreground">{n(r.value)}</span>
              </Tag>
            </li>
          );
        })}
      </ol>

      {bottom && <p className="mt-3 text-[11px] text-muted-foreground">Bottom of the hierarchy. Nothing here opens further.</p>}
    </div>
  );
}

demo.tsxHow it is called: errors by class then by endpoint, opened on the TimeoutError bar with eu-west and the hour still attached.

import { DrillDown, type Node } from "./DrillDown";

/**
 * Errors in eu-west over one hour, by class, then by endpoint. The demo lands
 * one level down, on the TimeoutError bar that was clicked, with the cluster,
 * the window and the 4,182 still attached. The crumb goes back up; the
 * endpoints are the bottom and say so.
 */
const ERRORS: Node = {
  name: "Errors",
  value: 8_582,
  children: [
    {
      name: "TimeoutError",
      value: 4_182,
      children: [
        { name: "POST /checkout", value: 2_310 },
        { name: "GET /cart", value: 1_104 },
        { name: "POST /payments/authorize", value: 512 },
        { name: "GET /search", value: 256 },
      ],
    },
    { name: "ConnectionReset", value: 1_960, children: [{ name: "GET /cart", value: 1_402 }, { name: "GET /search", value: 558 }] },
    { name: "UpstreamUnavailable", value: 1_410, children: [{ name: "POST /payments/authorize", value: 1_410 }] },
    { name: "RateLimited", value: 720, children: [{ name: "GET /search", value: 720 }] },
    { name: "Other", value: 310, children: [{ name: "GET /health", value: 310 }] },
  ],
};

export default function Demo() {
  return (
    <div className="max-w-[420px]">
      <DrillDown
        root={ERRORS}
        scope={{ cluster: "eu-west", from: new Date("2026-09-15T14:00:00Z"), to: new Date("2026-09-15T15:00:00Z") }}
        defaultPath={["TimeoutError"]}
      />
    </div>
  );
}
What it renders. Identical markup in both panes, with only the token values changing.

Examples

Captures whose hotspots reference this pattern, grouped by product and dated. The dashed boxes are this pattern; hover any box for the note.

Grafana

The reference implementation for panel grids, template variables, and stat panels; most other tools are defined by how they differ from it.

Examples / Alert List September 10, 2026 Grafana Play (signed out; no version string exposed) medium · dark · desktop-web
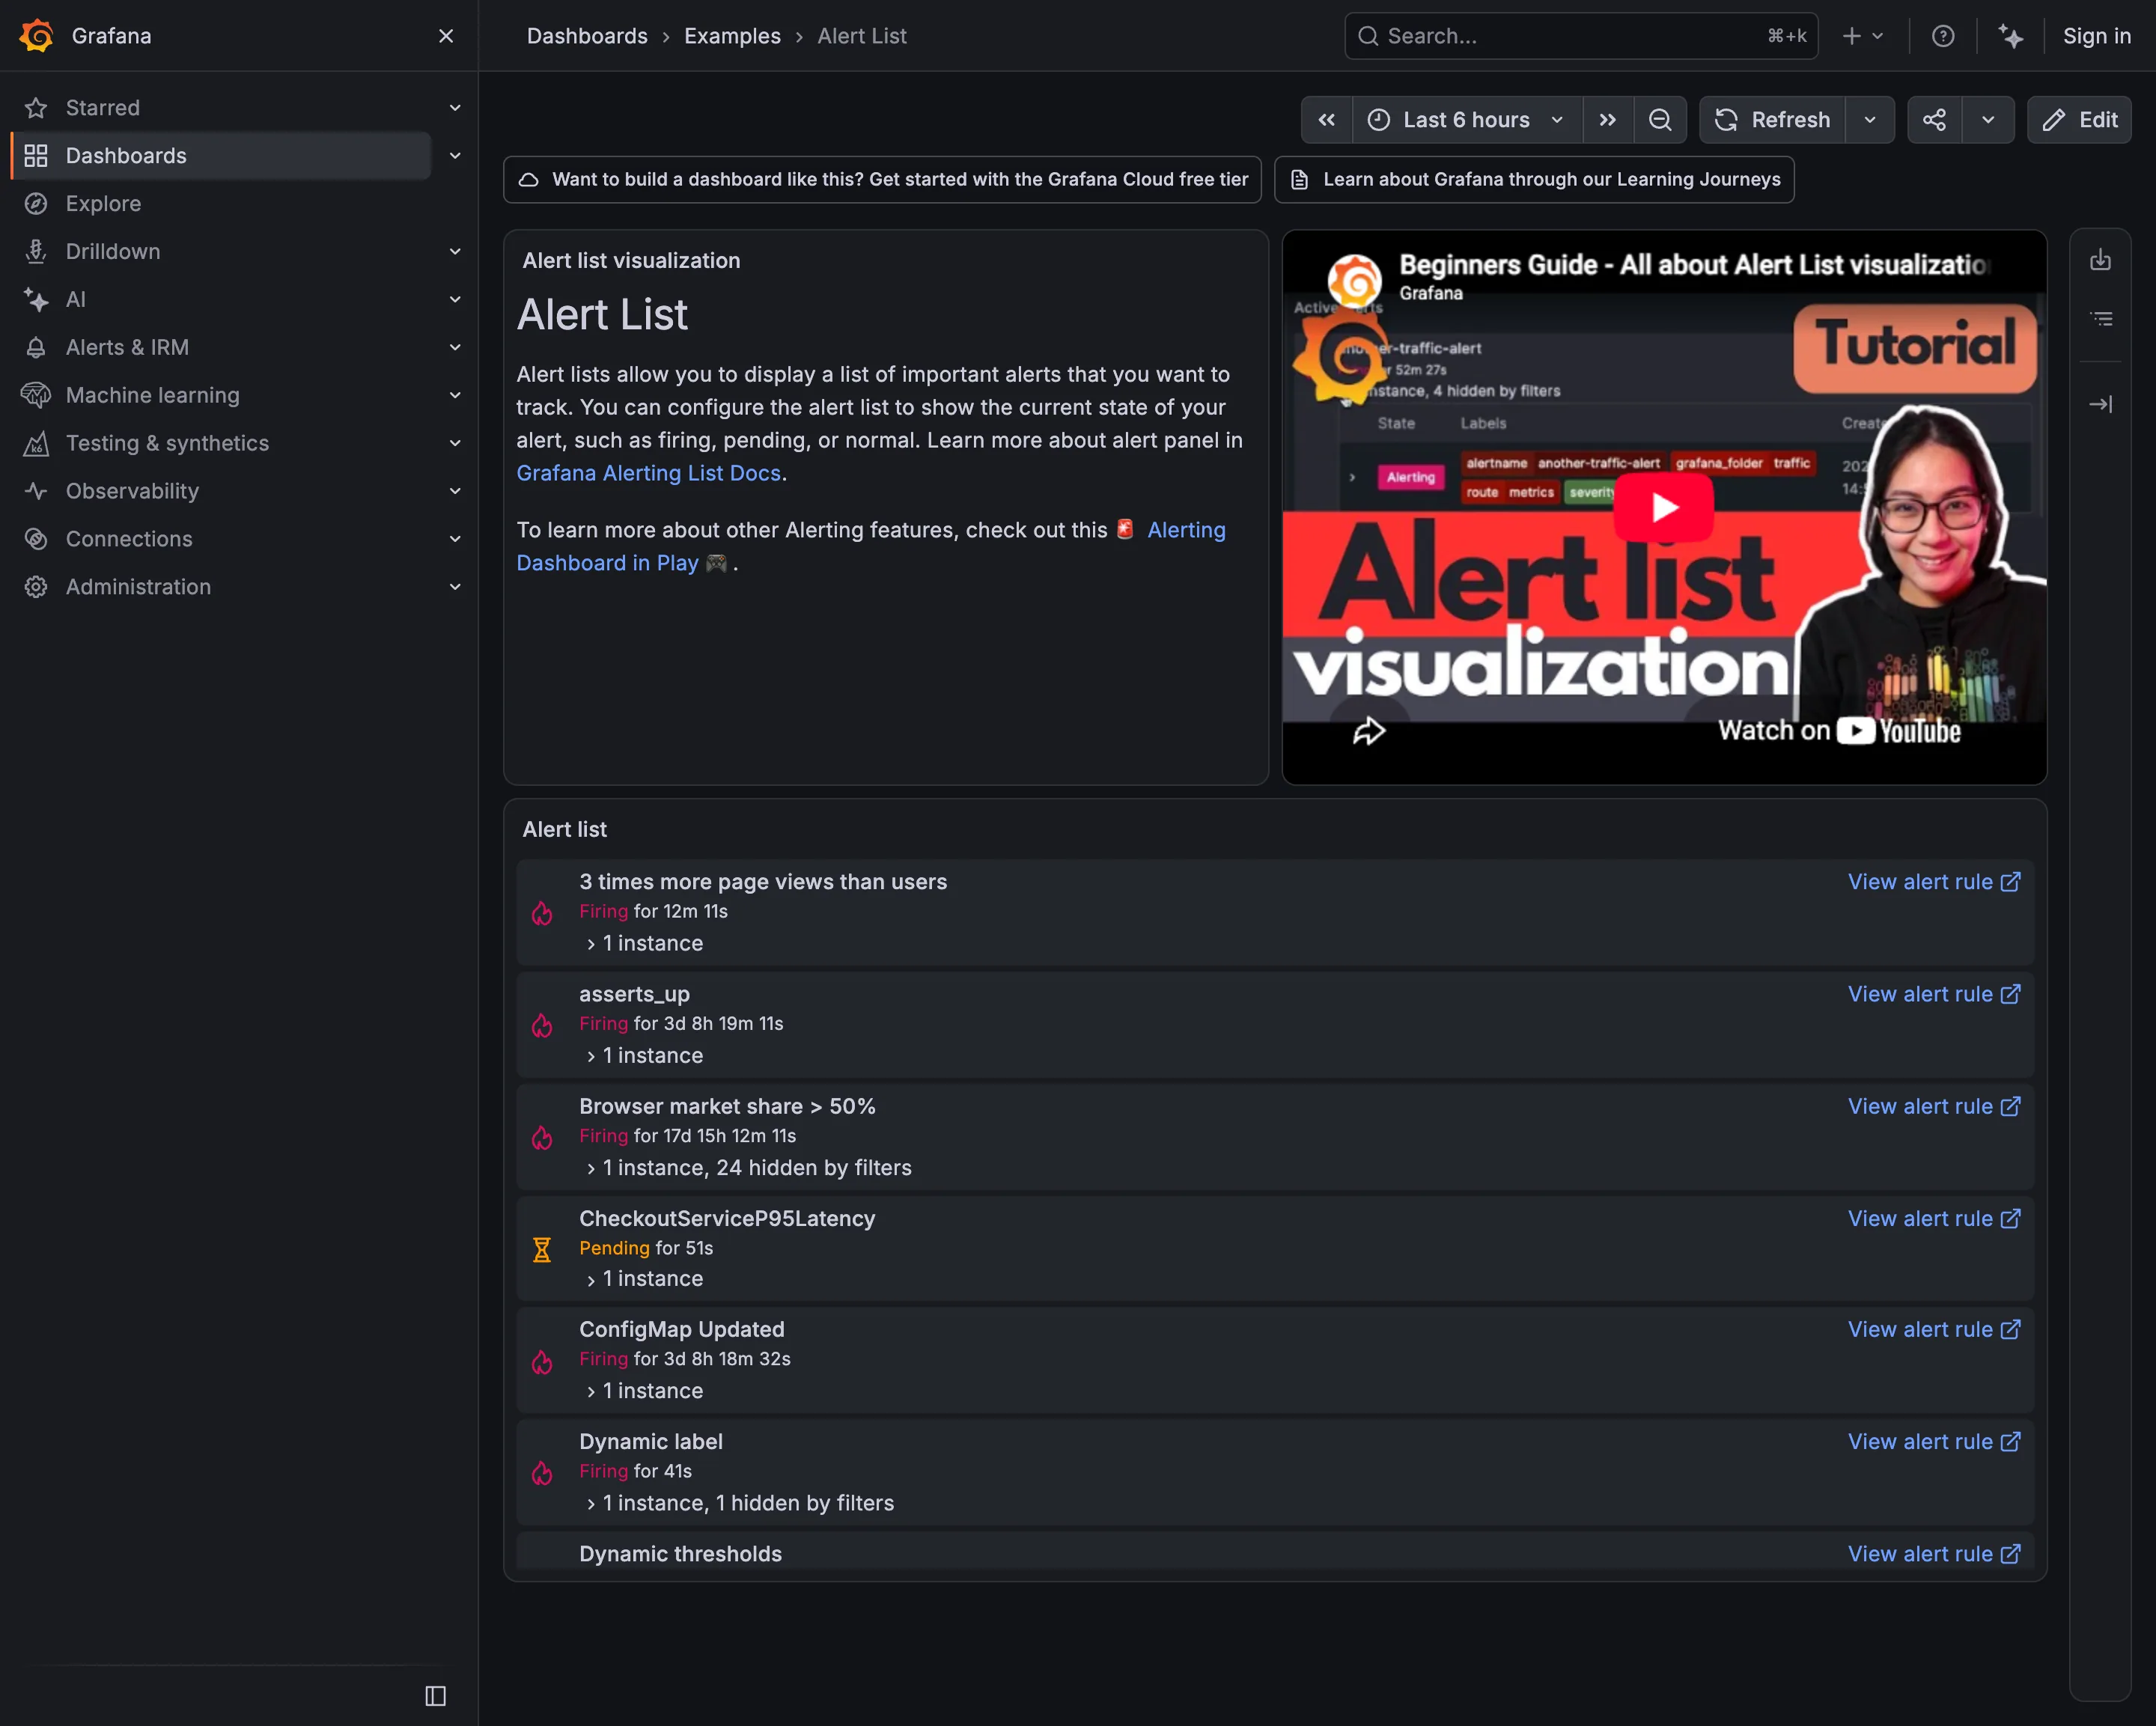
Seven alerts, and the durations are the story. "Browser market share > 50%" has been firing for 17 days, 15 hours and 12 minutes. Two more have been firing for over three days. An alert that has been true for two and a half weeks is not telling anyone anything—it has become part of the background, and the list it sits in is now a list you scroll past. The other thing worth reading is the names. Six alerts, six conventions: a full sentence, a metric identifier in snake case, a camel-case service name, a two-word phrase, and two that just say "Dynamic". Somebody arriving at this list at three in the morning cannot tell from the names what is broken or how badly, which is work the naming could have done for free.
  • Alert rule attached to panel Seven rules in six naming conventions. Nothing in the list conveys severity or subject.
  • Alert rule attached to panel Firing for 17 days. Still actionable, in principle; nobody has acted for two and a half weeks.
  • Semantic status color Pending rather than firing: the threshold is met and the duration isn't. Two states, both named.
  • Filter bar "1 instance, 24 hidden by filters"—the list saying what it is not showing you.
  • Drill-down The route from an alert back to the rule that defined it, on every row.
Show 1 more example Hide the rest

Grafana

The reference implementation for panel grids, template variables, and stat panels; most other tools are defined by how they differ from it.

Examples / Logs Panel September 10, 2026 Grafana Play (signed out; no version string exposed) medium · dark · desktop-web
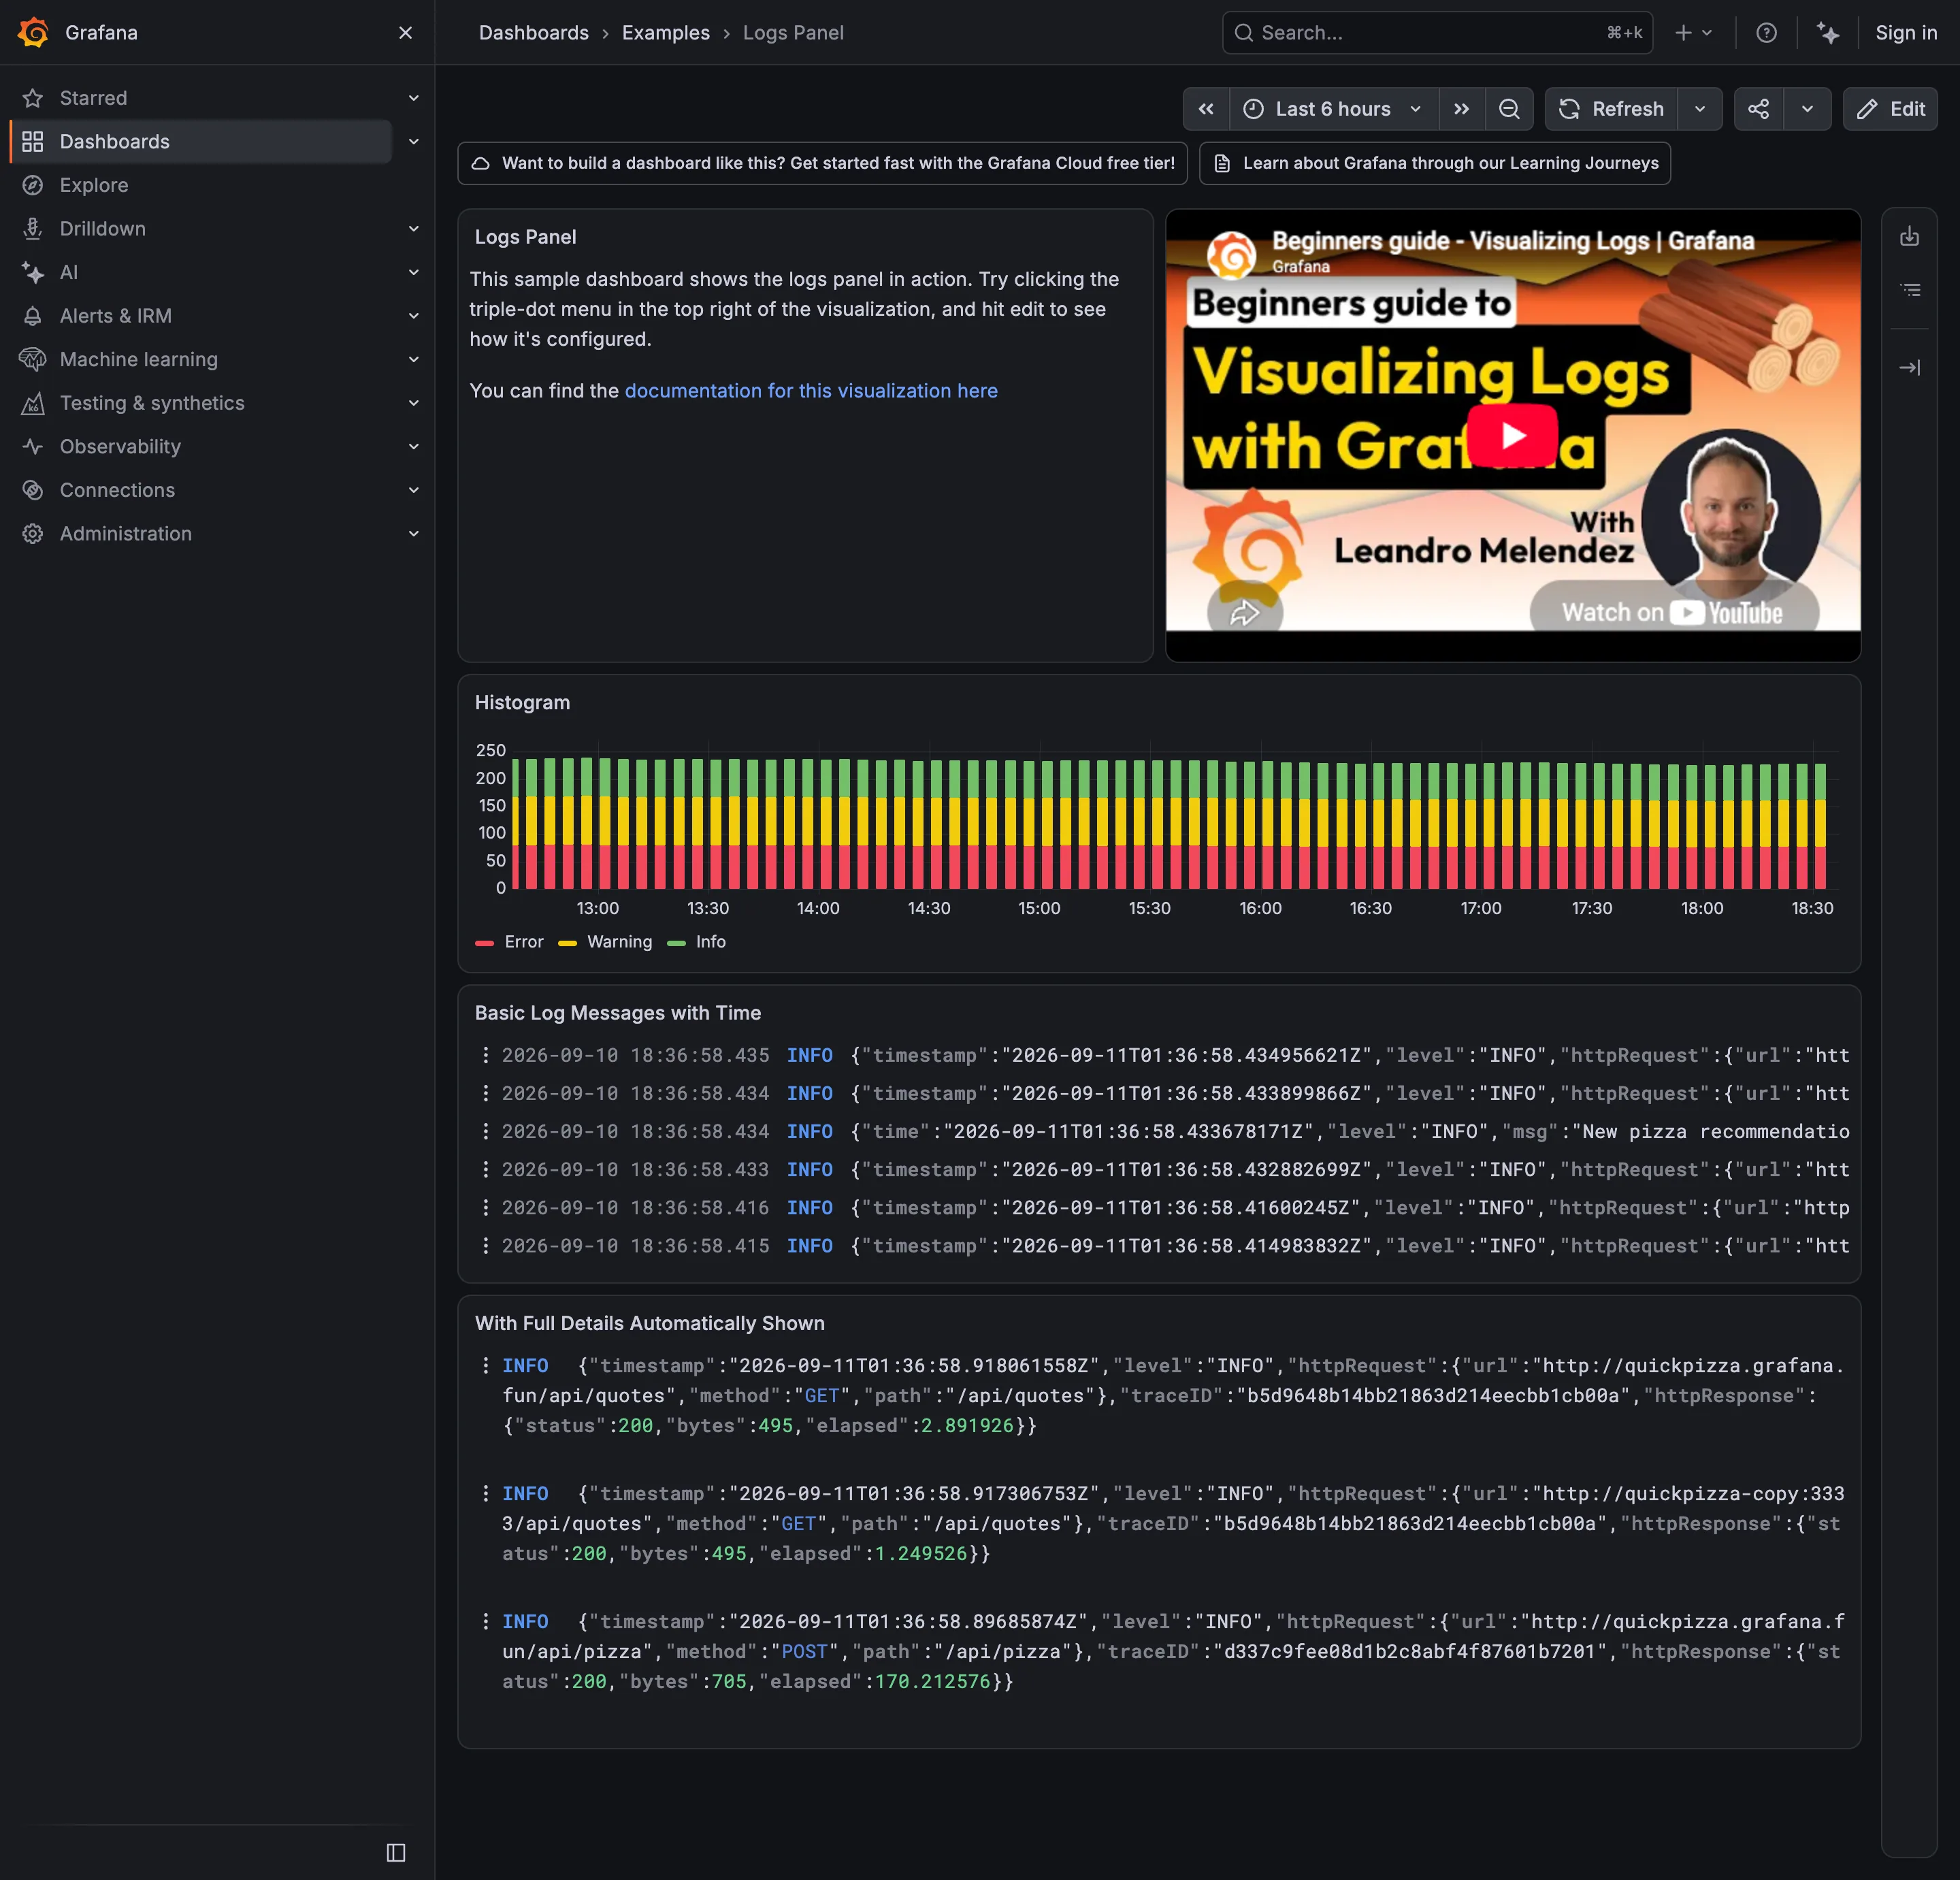
The arrangement is the standard one and it is right: a stacked volume chart by log level across the top, then the raw stream underneath, so the shape of the traffic and the individual lines share one page. Two details are worth stopping on. Every line carries two timestamps in two timezones—the gutter reads 2026-09-10 18:36:58.435 in the browser's local time, and the JSON three characters later reads 2026-09-11T01:36:58.434956621Z in UTC. Same instant, seven hours apart, on the same row, and nothing labels either one. The second is the trace ID in the expanded panel at the bottom, which is the thing that makes a log line usable: it is the route from a line of text to the request it came from. Two of the three entries shown carry the identical trace ID, which is also the case deduplication exists for.
  • Stacked composition Volume by level over time. The bottom band sits on a flat baseline; the two above it are approximate.
  • Log tail Raw lines, truncated at the right edge, with two timestamps in two timezones on every row.
  • Drill-down The trace ID: the route out of the wall of text and into the request that produced it.