Skip to content
KONIGI

Dashboards / Product mechanics / Empty state

5 of 10

Empty state

There's nothing to show, and the page has to say why and what to do.

Updated September 9, 2026

Problem

The panel has nothing in it. The viewer can’t tell whether that means nothing happened, something broke, or they never finished setting it up, and those three call for completely different responses.

Solution

Say which kind of empty this is, then say what to do about it.

NN/g frames the job as three things: communicate system status, provide learning cues, and give a direct path to the key task. On a dashboard the first one carries most of the weight, because a dashboard’s empty state is a factual claim about the world, and it’s frequently wrong.

The distinction that matters here and rarely comes up elsewhere: no data is not zero. A panel showing 0 errors and a panel whose query returned nothing look nearly identical and mean opposite things. One says the system is healthy. The other says you can’t tell. Grafana treats this as a first-class problem on its alerting side, where No Data is its own state with four possible mappings—Set No Data state, Set Alerting state, Set Normal state, Keep last state—and the default refuses to call it normal, creating a DatasourceNoData instance instead. The panel side of the same product is less careful. The “No value” standard option defaults to a hyphen.

Use when

Always. Every container that can be empty will be empty for somebody, usually on their first day, and usually at the moment they’re deciding whether the tool works.

Don’t use when

Never skip the state. Do skip the illustration. A dashboard someone opens forty times a day shouldn’t spend viewings five through forty on a friendly graphic explaining a condition they already understand.

Trade-offs

Empty states get written once, by someone who knows exactly why the container is empty, and read by someone who doesn’t. They age badly: the copy names a button that was renamed two releases ago, or an integration that no longer exists. And the well-meaning versions absorb real failures. A query that errored, a permission the viewer doesn’t hold, and a genuinely empty result all end up behind the same cheerful “Nothing here yet”, which converts a fault into a shrug.

Checklist

  • Which empty is this: never configured, configured but no data yet, filtered down to nothing, or failed?
  • Does the copy distinguish “no data” from “zero”, and would the viewer read it correctly at a glance?
  • If a filter caused it, does the state name the filter and offer to clear it?
  • If a time range caused it, does it say the range? “No records for the selected date range” answers a question a blank panel leaves open.
  • Is there exactly one obvious next action, and does this viewer have permission to take it?
  • What does this look like on the fortieth viewing rather than the first?
  • Can an error ever land here instead of in an error state?
  • Does the empty state occupy the space the content will, so the layout doesn’t jump when data arrives?
  • Is it real text a screen reader can reach, or a background image?
  • Who owns this copy when the thing it references gets renamed?

Compare

Grafana is two products on this question. Its alerting side treats No Data as a state you have to consciously map, with four options and a default that won’t call missing data healthy. Its panel side renders a missing value as a hyphen, which on a wallboard ten feet away is a dash that tells the viewer nothing. Sentry makes the empty project be the install flow, putting the DSN and the snippet on the page, on the reasonable bet that a project with no events is a project nobody has wired up yet. Honeycomb is query-first, so an empty result leaves the query builder in place and the state implicitly reads “your query was fine and matched nothing”, which is a different and more useful claim than “there is no data here”. Netdata mostly sidesteps the first-run version by auto-discovering what’s running on the node, which moves the empty state up a level: the question becomes whether the agent is connected, not whether a chart has data.

Loading state is the frame immediately before this one, and confusing the two is the most common bug in the family. Error and stale state is the sibling that should be catching what empty states wrongly absorb. Freshness indicator answers “as of when”, which an empty panel makes urgent. Filter bar is the usual cause. Data source badge says where the nothing came from.
Empty state anatomy Three panels that a careless product renders identically: one that has never had data, one whose filters match nothing, and one showing a genuine zero. Each says which kind of empty it is and offers the action that fits. Three kinds of nothing Checkout errors Nothing here yet This panel has never received a sample. connect a source Never had data Checkout errors No data The query returned nothing. You can't tell. clear two filters Can't tell Checkout errors 0 in the last hour, from 2.1M requests A real zero 1 2 3 1 SAY WHICH KIND Communicate status, give a learning cue, and offer a direct path to the task. On a dashboard the first carries most of it. 2 NO DATA IS NOT ZERO These two look nearly identical and mean opposite things. One says the system is healthy; the other says you can't tell. 3 A ZERO NEEDS ITS DENOMINATOR Zero out of two million is good news. Zero out of zero is the panel above, and a bare hyphen tells you which neither.
Wireframe — the pattern's anatomy, not any one product's version of it

Implementation

Nothing to show, and the reason decides the copy. No data yet, no data matching the filter, and query failed are three different situations, and a single friendly illustration for all three is how readers learn to distrust the page.

shadcn
npx shadcn@latest add button card
Tokens
--card--card-foreground--muted-foreground--border--chart-1

Checkout errors

Nothing here yet

This panel has never received a sample.

Checkout errors

No data

The query returned nothing for region = eu-west, client = ios.

Checkout errors

0

in the last hour, from 2.1M requests

EmptyPanel.tsxA closed union of the three kinds. The filtered kind names its filters, the zero carries its denominator.

import { Button } from "@/components/ui/button";
import { Card } from "@/components/ui/card";

/**
 * Three kinds of nothing, as a closed union. A careless product renders them
 * identically, and they mean opposite things: one says the system is healthy,
 * one says you can't tell, one says nobody has wired this up yet. Each kind
 * carries the one thing its copy needs, so the panel cannot say "No data"
 * without saying which.
 */
export type Empty =
  /** Never received a sample. The next action is setup, not a filter. */
  | { kind: "never"; onConnect: () => void }
  /** Configured, but the query matched nothing. At least one filter, because the copy names them. */
  | { kind: "filtered"; filters: [string, ...string[]]; onClear: () => void }
  /** A real zero. It needs its denominator: zero out of two million is good news, zero out of zero is the first kind. */
  | { kind: "zero"; window: string; outOf: string };

const WORDS = ["no", "one", "two", "three", "four", "five"];
const count = (n: number, noun: string) => `${WORDS[n] ?? n} ${noun}${n === 1 ? "" : "s"}`;

export function EmptyPanel({ title, state }: { title: string; state: Empty }) {
  return (
    <Card className={`h-[150px] p-4 ${state.kind === "filtered" ? "border-2 border-chart-1" : ""}`}>
      <p className="text-[11px] uppercase tracking-wide text-muted-foreground">{title}</p>

      {state.kind === "never" && (
        <>
          <p className="mt-5 text-sm text-card-foreground">Nothing here yet</p>
          <p className="mt-1 text-[11px] text-muted-foreground">This panel has never received a sample.</p>
          <Button variant="outline" size="sm" className="mt-3 h-6 px-2 text-[10px]" onClick={state.onConnect}>connect a source</Button>
        </>
      )}

      {state.kind === "filtered" && (
        <>
          <p className="mt-5 text-sm text-card-foreground">No data</p>
          <p className="mt-1 text-[11px] text-muted-foreground">
            The query returned nothing for {state.filters.join(", ")}.
          </p>
          <Button variant="outline" size="sm" className="mt-3 h-6 px-2 text-[10px]" onClick={state.onClear}>
            clear {count(state.filters.length, "filter")}
          </Button>
        </>
      )}

      {state.kind === "zero" && (
        <>
          <p className="mt-4 text-4xl font-medium tabular-nums text-card-foreground">0</p>
          <p className="mt-2 text-[11px] tabular-nums text-muted-foreground">in the {state.window}, from {state.outOf}</p>
        </>
      )}
    </Card>
  );
}

demo.tsxHow it is called: the same panel in all three kinds. Clearing the filters turns the middle one into the real zero.

import { useState } from "react";
import { EmptyPanel, type Empty } from "./EmptyPanel";

/**
 * The same panel three times, once per kind of empty. Clearing the two
 * filters on the middle one turns it into the real zero on the right, which
 * is the whole distinction: nothing matched, against nothing happened.
 */
export default function Demo() {
  const [middle, setMiddle] = useState<Empty>({
    kind: "filtered",
    filters: ["region = eu-west", "client = ios"],
    onClear: () => setMiddle({ kind: "zero", window: "last hour", outOf: "2.1M requests" }),
  });
  return (
    <div className="grid gap-5 sm:grid-cols-3">
      <EmptyPanel title="Checkout errors" state={{ kind: "never", onConnect: () => console.log("open the source picker") }} />
      <EmptyPanel title="Checkout errors" state={middle} />
      <EmptyPanel title="Checkout errors" state={{ kind: "zero", window: "last hour", outOf: "2.1M requests" }} />
    </div>
  );
}
What it renders. Identical markup in both panes, with only the token values changing.

Examples

Captures whose hotspots reference this pattern, grouped by product and dated. The dashed boxes are this pattern; hover any box for the note.

Netdata

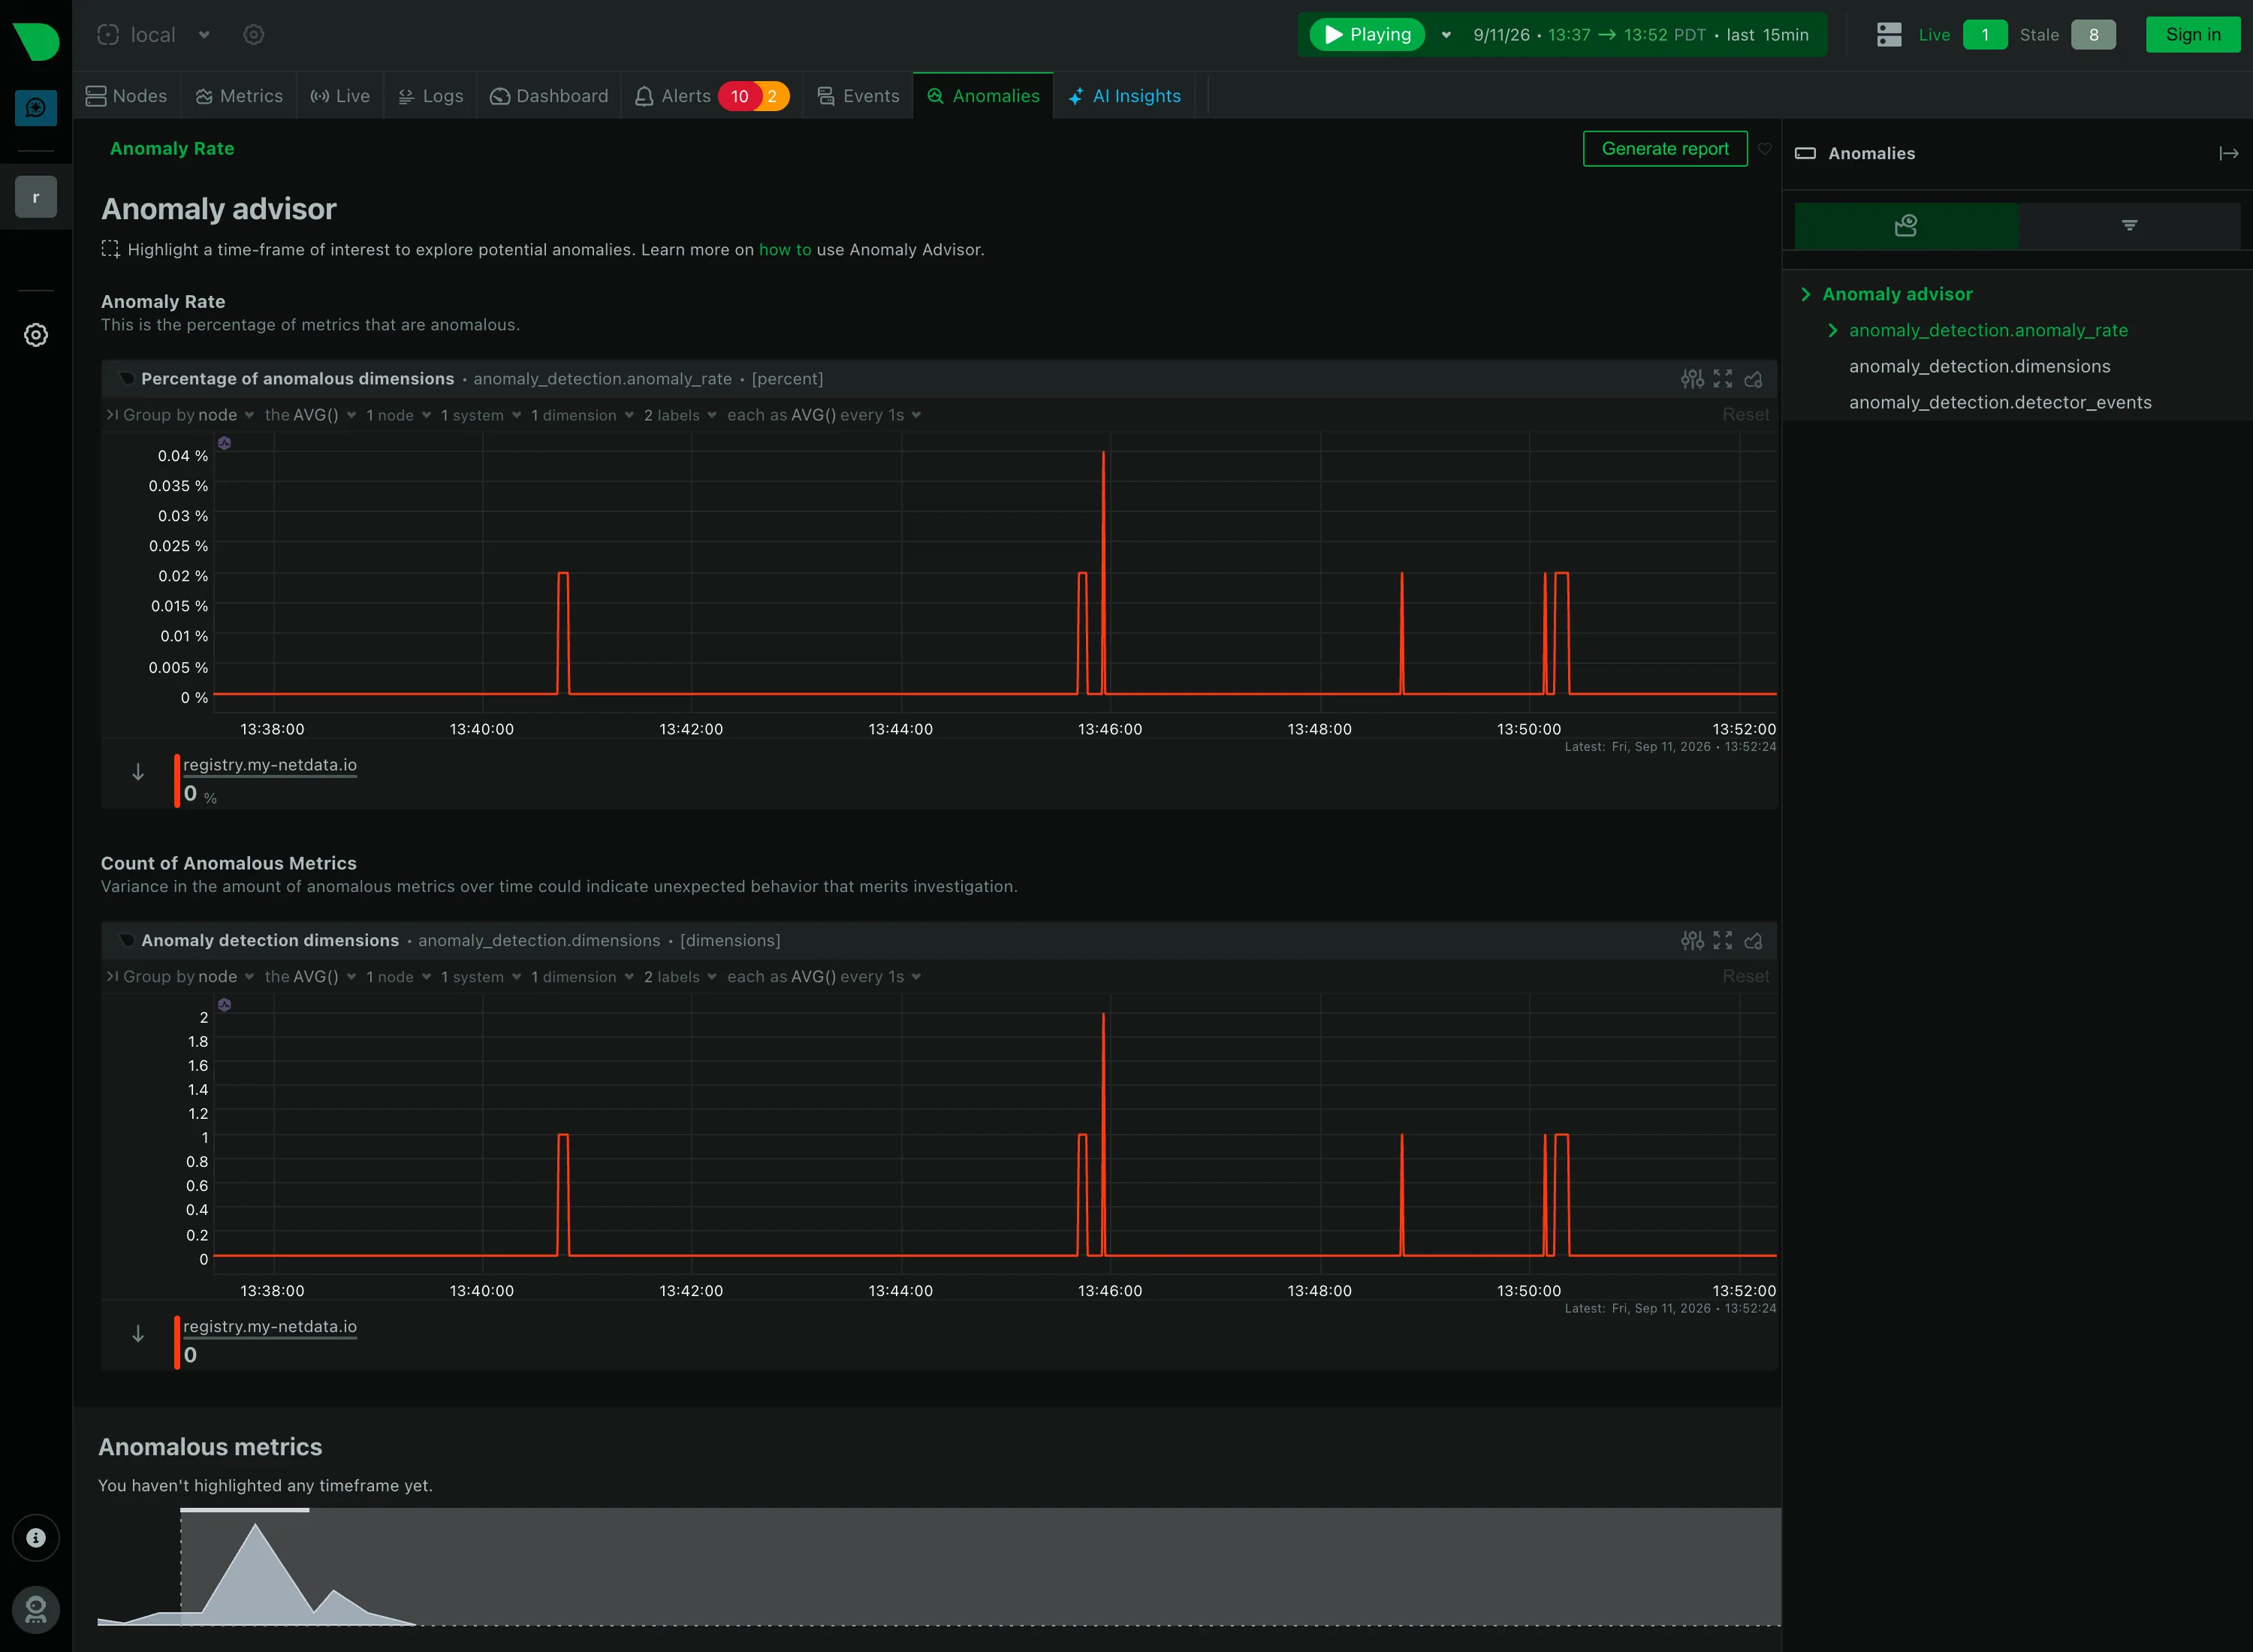
Per-second charts, hundreds per node, with a per-chart anomaly ribbon instead of a band on the series.

Anomalies / Anomaly advisor September 11, 2026 Netdata Agent, Anomaly advisor (public registry node, signed out) medium · dark · desktop-web
Netdata answers the anomaly problem without drawing a band at all, and the difference is worth recording. Rather than shading an expected range around each series, it scores every metric continuously and plots the result as its own series: the percentage of dimensions currently anomalous, and beneath it the count. Both sit near zero for most of the window and spike to about 0.04% at five separate moments. The trade is clear once you see it. A band tells you whether this metric is behaving, on the same axes as the metric, and needs one per chart. A rate tells you whether anything at all is behaving, in one chart, and cannot tell you which thing without a second step—which is what the panel at the bottom is for, and why it currently reads "You haven't highlighted any timeframe yet." The finding requires a brush selection before it will name a single metric.
  • Anomaly band Not a band. An anomaly rate as its own series, so one chart covers every metric instead of one band per chart.
  • Explain this metric Every section carries a sentence saying what it counts, directly under its heading rather than behind an icon.
  • Cross-filter Highlight a timeframe and the page names which metrics drove it. The selection is the query.
  • Empty state "You haven't highlighted any timeframe yet"—the reason for the blank, and the action that fills it.
  • Share and embed Generate report, top right. Whether the highlighted window travels with it is the question the button raises.
Show 1 more example Hide the rest

Grafana

The reference implementation for panel grids, template variables, and stat panels; most other tools are defined by how they differ from it.

Linux node / fleet overview September 9, 2026 Grafana Play (signed out; no version string exposed) medium · dark · desktop-web
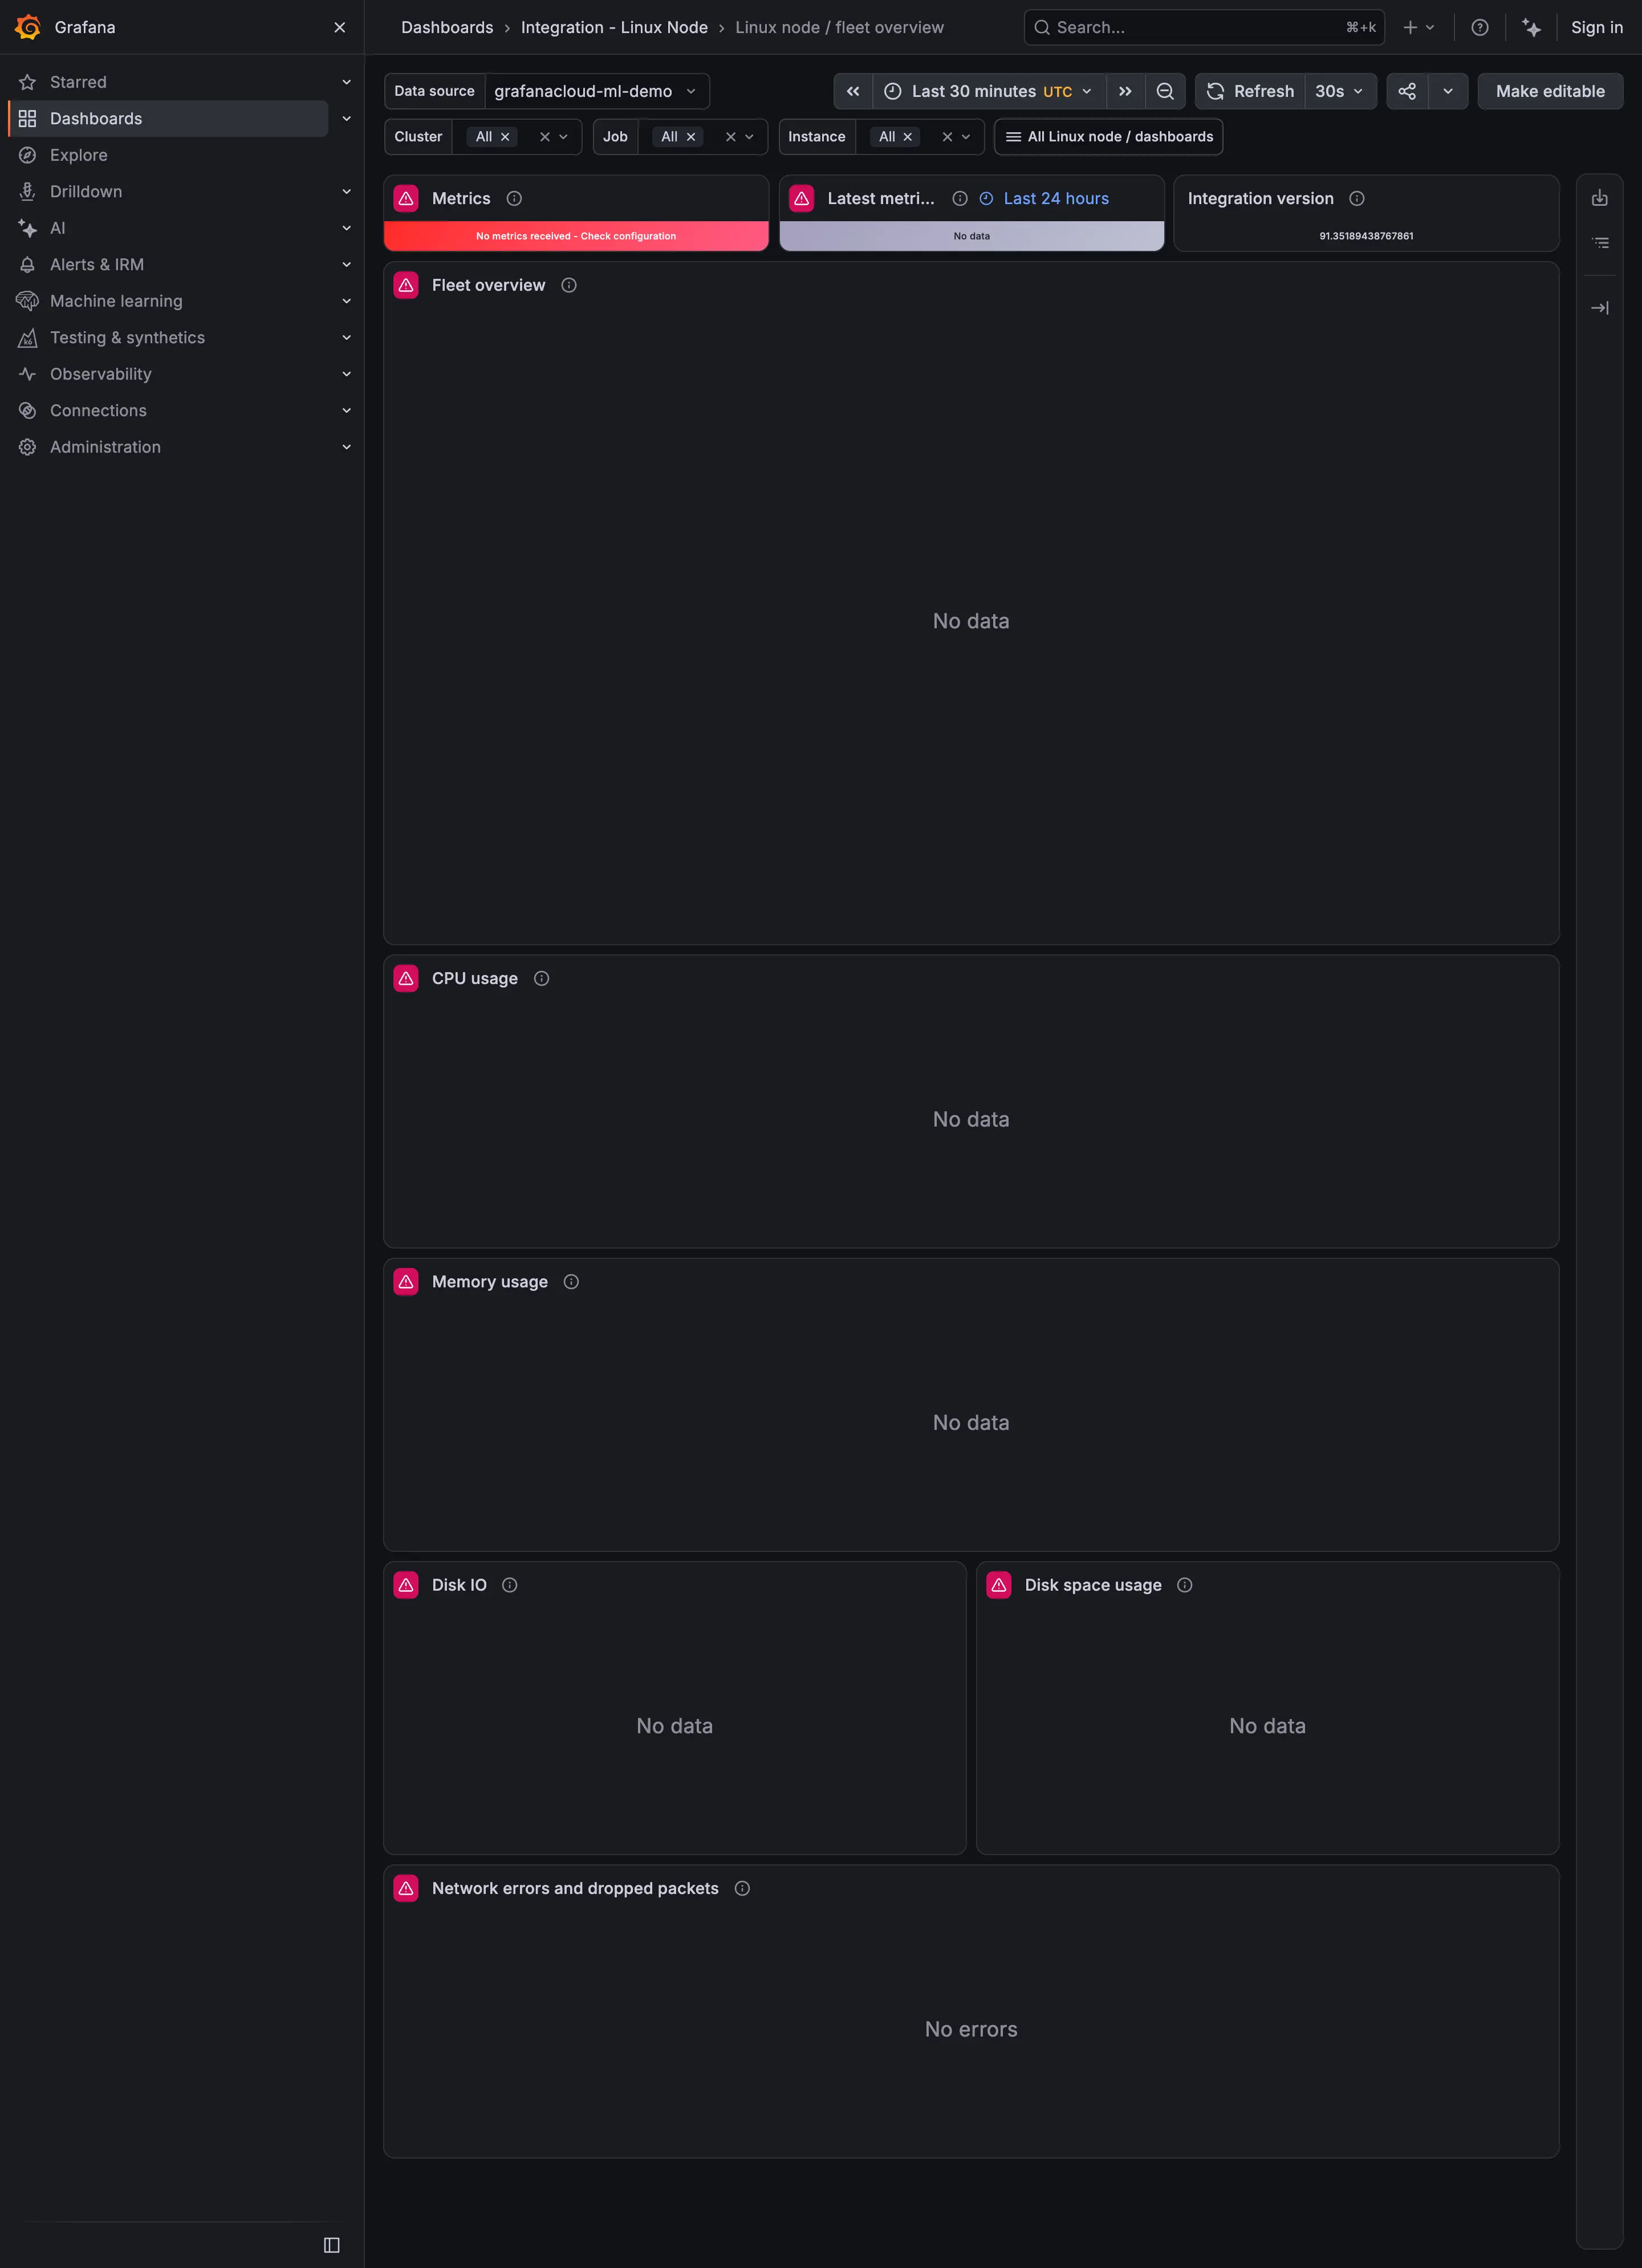
Captured while Play's demo data source was returning nothing, which makes this a better example of empty and error states than of the fleet overview it is meant to be. Three things are worth noticing. The top-left tile is red and reads "No metrics received - Check configuration", which is an actual diagnosis and the best thing on the page. The tile beside it exists to report when data last arrived, and it says "No data", so the freshness indicator has no freshness to report and doesn't say why. And every chart below says "No data" while the network panel says "No errors". A viewer scanning this page cannot tell from the words alone whether the network is clean or whether it is as unknown as everything else, which is the exact confusion the empty-state pattern exists to prevent.