Builds the page around the question rather than the chart: funnels, retention grids and cohort comparisons are first-class objects, not panel types.
Product analyticsProduct analytics
Who used what, and whether the thing you shipped changed it. Cohorts and funnels over counts.
Products 4
Board of saved reports rather than a designed page, which is what product analytics tends to become once more than one team is asking questions.
Product analyticsA metric row controls the main chart, followed by focused traffic breakdowns.
Product analytics · SEO and GEOPublished workbooks show how individual authors arrange charts and interactions in Tableau.
Embedded analytics · Product analyticsPatterns seen in this domain 20
- Calendar heatmap
- Categorical series palette
- Cohort grid
- Cross-filter
- Dashboard builder
- Filter bar
- Funnel
- Geo map with markers
- Header KPI strip
- Hover detail
- Overview then detail
- Ranked list
- Ratio and rate
- Sankey and path
- Sequential and diverging scales
- Single-column narrative
- Small multiples
- Tabs as genres
- Target and progress
- Time series
Captures
Newest first within each product.
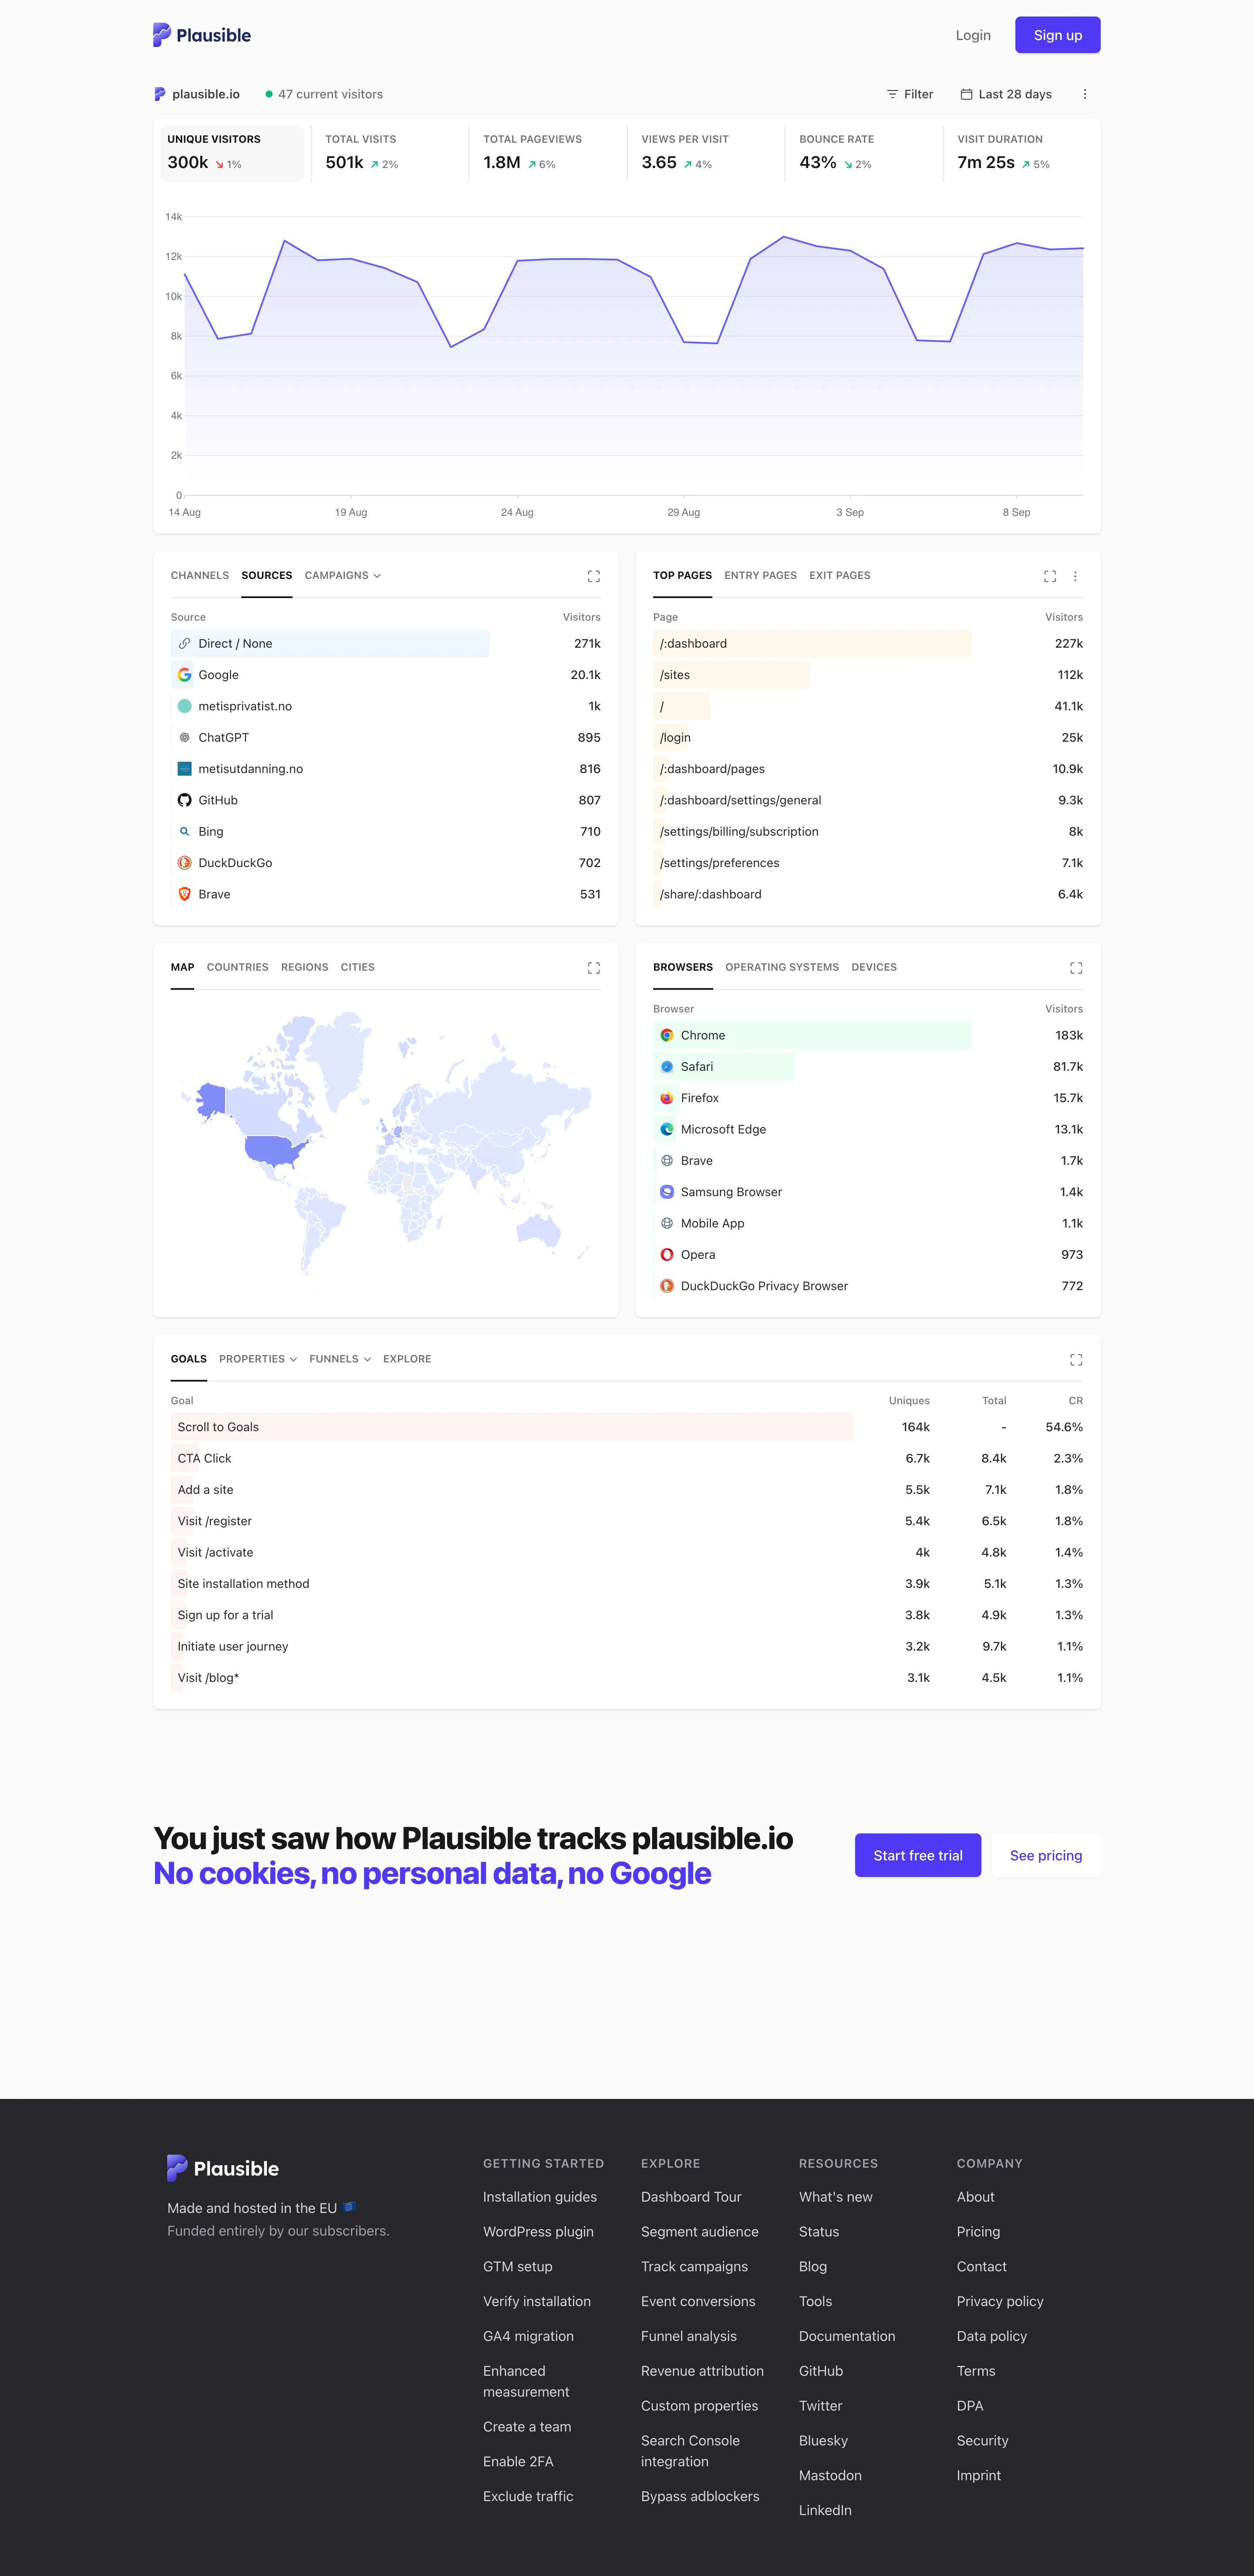
Single-column narrative. The page presents a summary followed by supporting breakdowns. Overview then detail. Breakdowns narrow the subject without leaving the page. Ranked list. The ranking shows counts and bars without a share-of-total column. Geo map with markers. Most countries have similarly pale fills, making differences hard to see. Header KPI strip. The selected metric tile controls the chart below. Ratio and rate. The rate’s context is spread across the tile row and page header. Tabs as genres. Tabs let one panel show several related breakdowns.
- Single-column narrative The page presents a summary followed by supporting breakdowns.
- Header KPI strip The selected metric tile controls the chart below.
- Ratio and rate The rate’s context is spread across the tile row and page header.
- Overview then detail Breakdowns narrow the subject without leaving the page.
- Ranked list The ranking shows counts and bars without a share-of-total column.
- Geo map with markers Most countries have similarly pale fills, making differences hard to see.
- Tabs as genres Tabs let one panel show several related breakdowns.
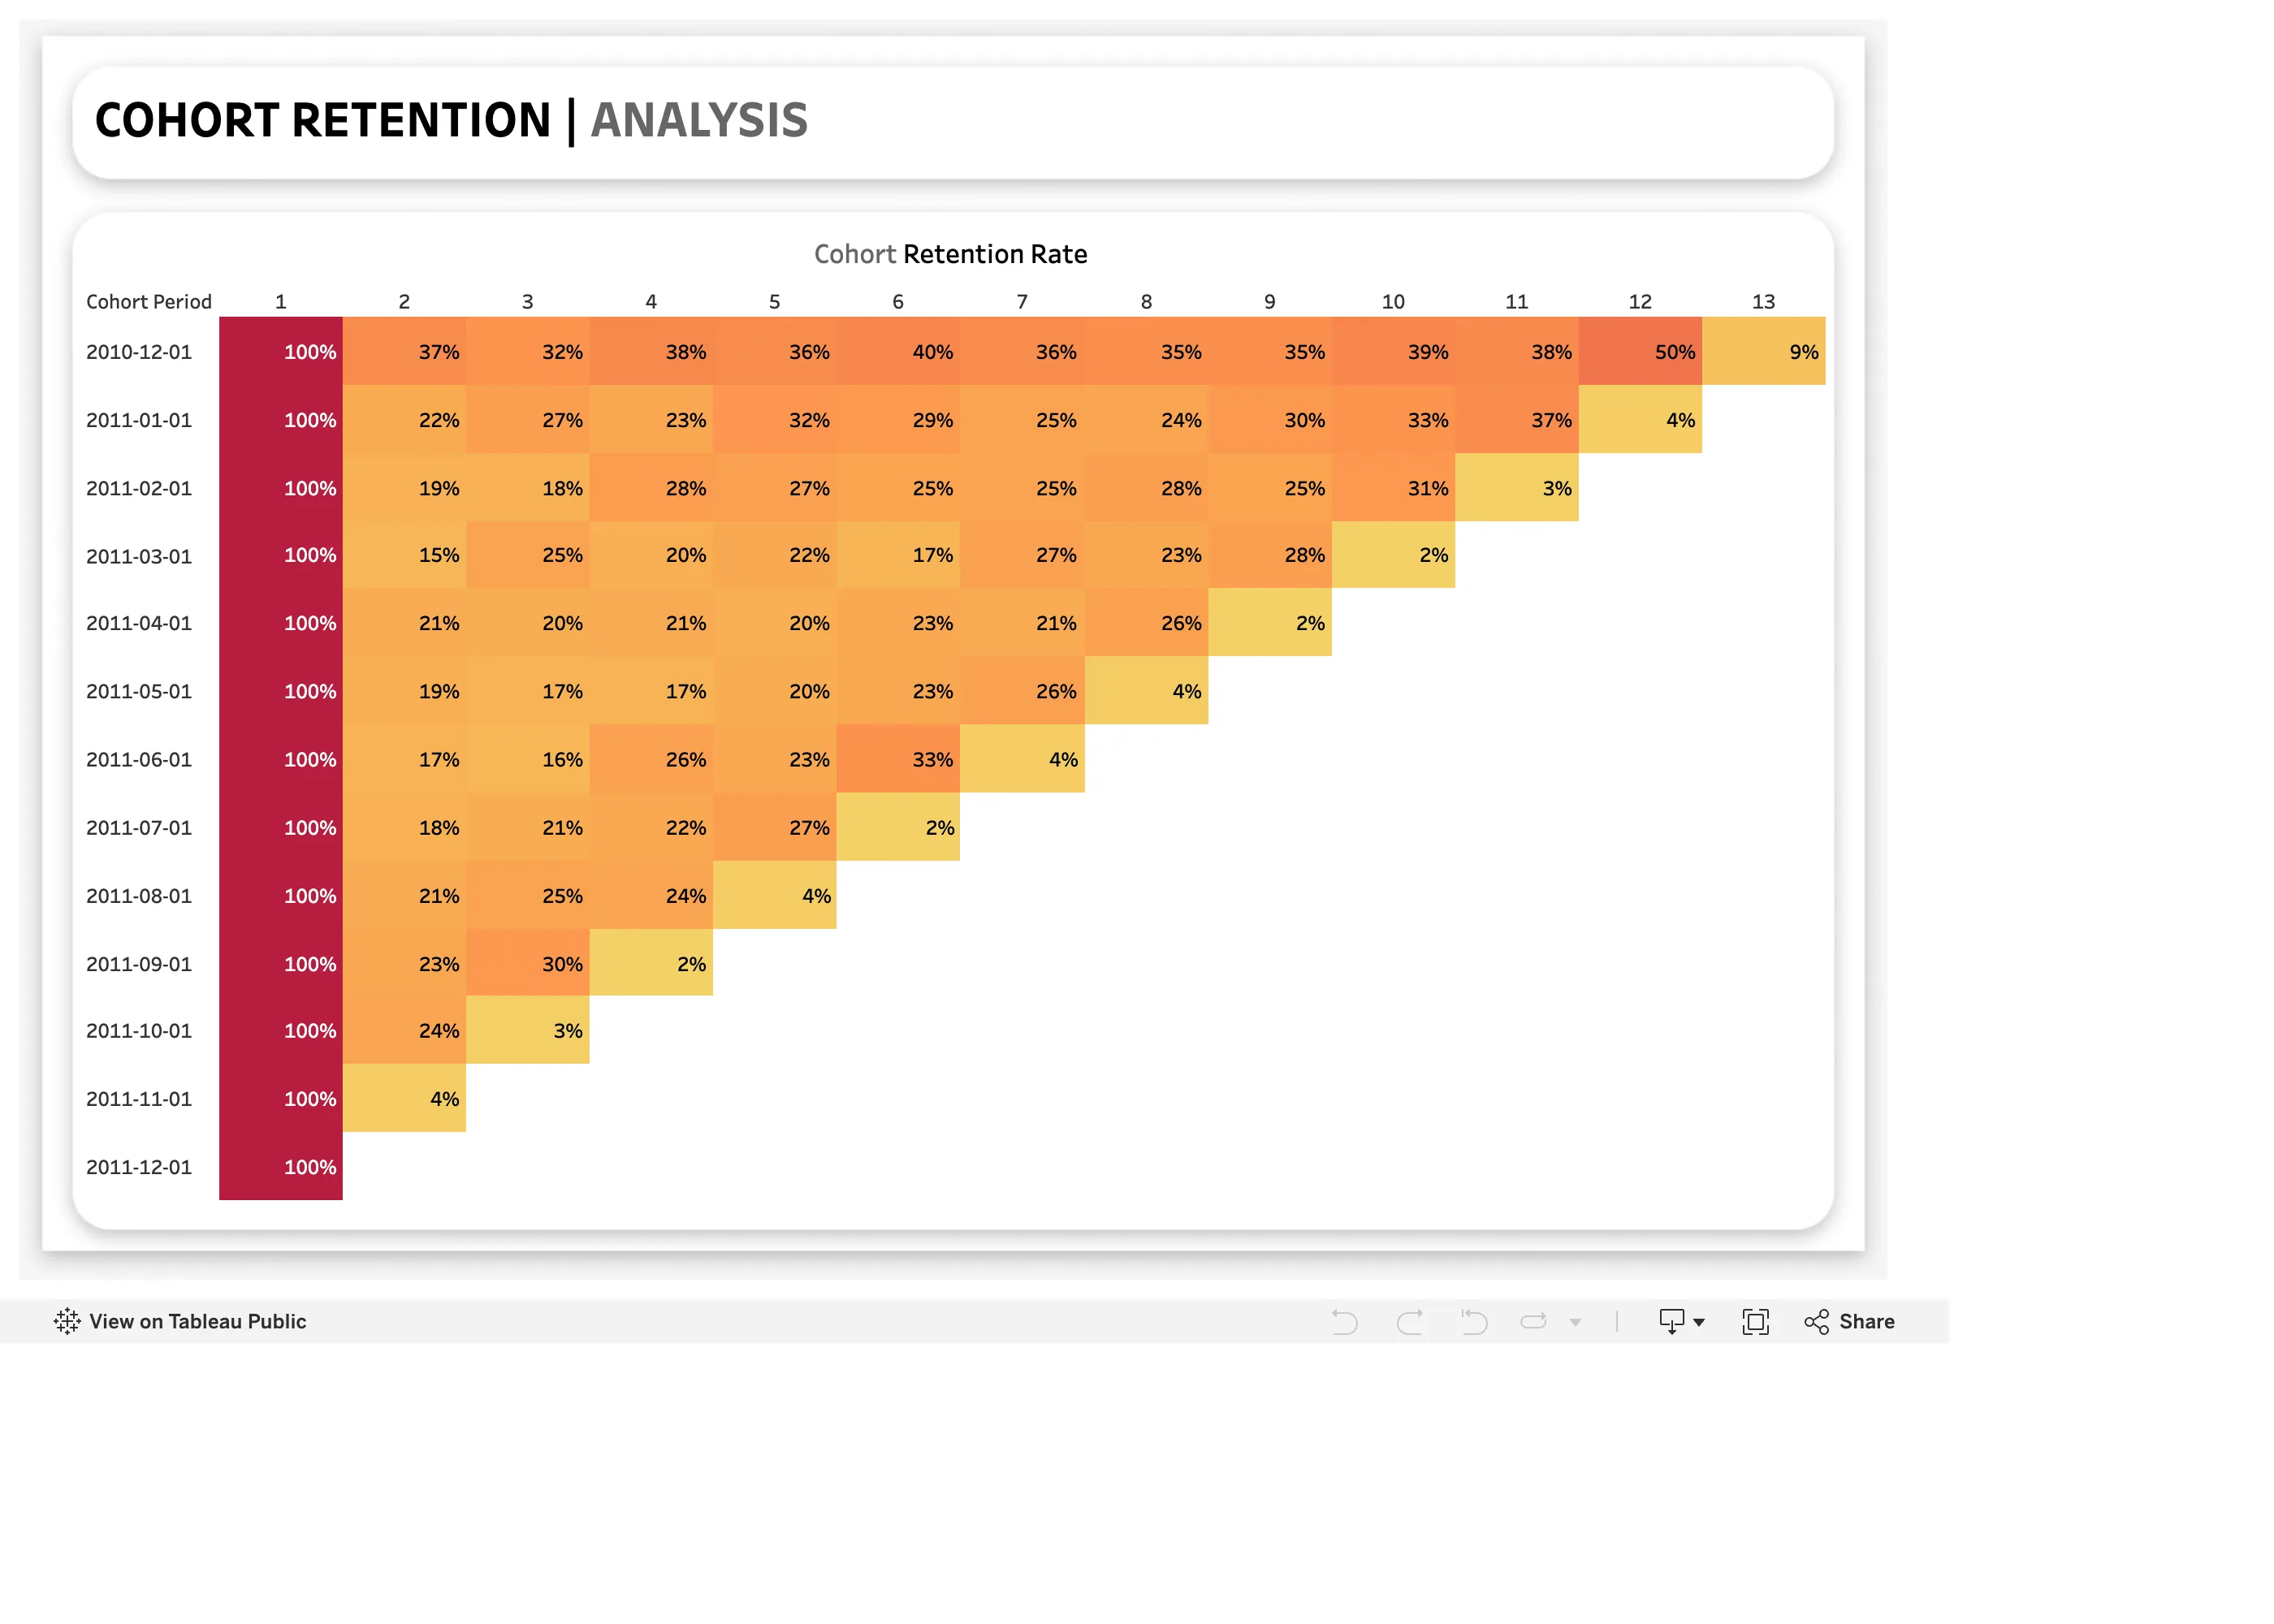
Cohort grid. Rows represent groups and columns represent elapsed periods. Ratio and rate. Group dates appear without starting population sizes. Sequential and diverging scales. The constant 100% first column sets the top of the color range. Cohort grid. Low final cells need an indication of whether the period is complete.
- Cohort grid Rows represent groups and columns represent elapsed periods.
- Cohort grid Low final cells need an indication of whether the period is complete.
- Sequential and diverging scales The constant 100% first column sets the top of the color range.
- Ratio and rate Group dates appear without starting population sizes.
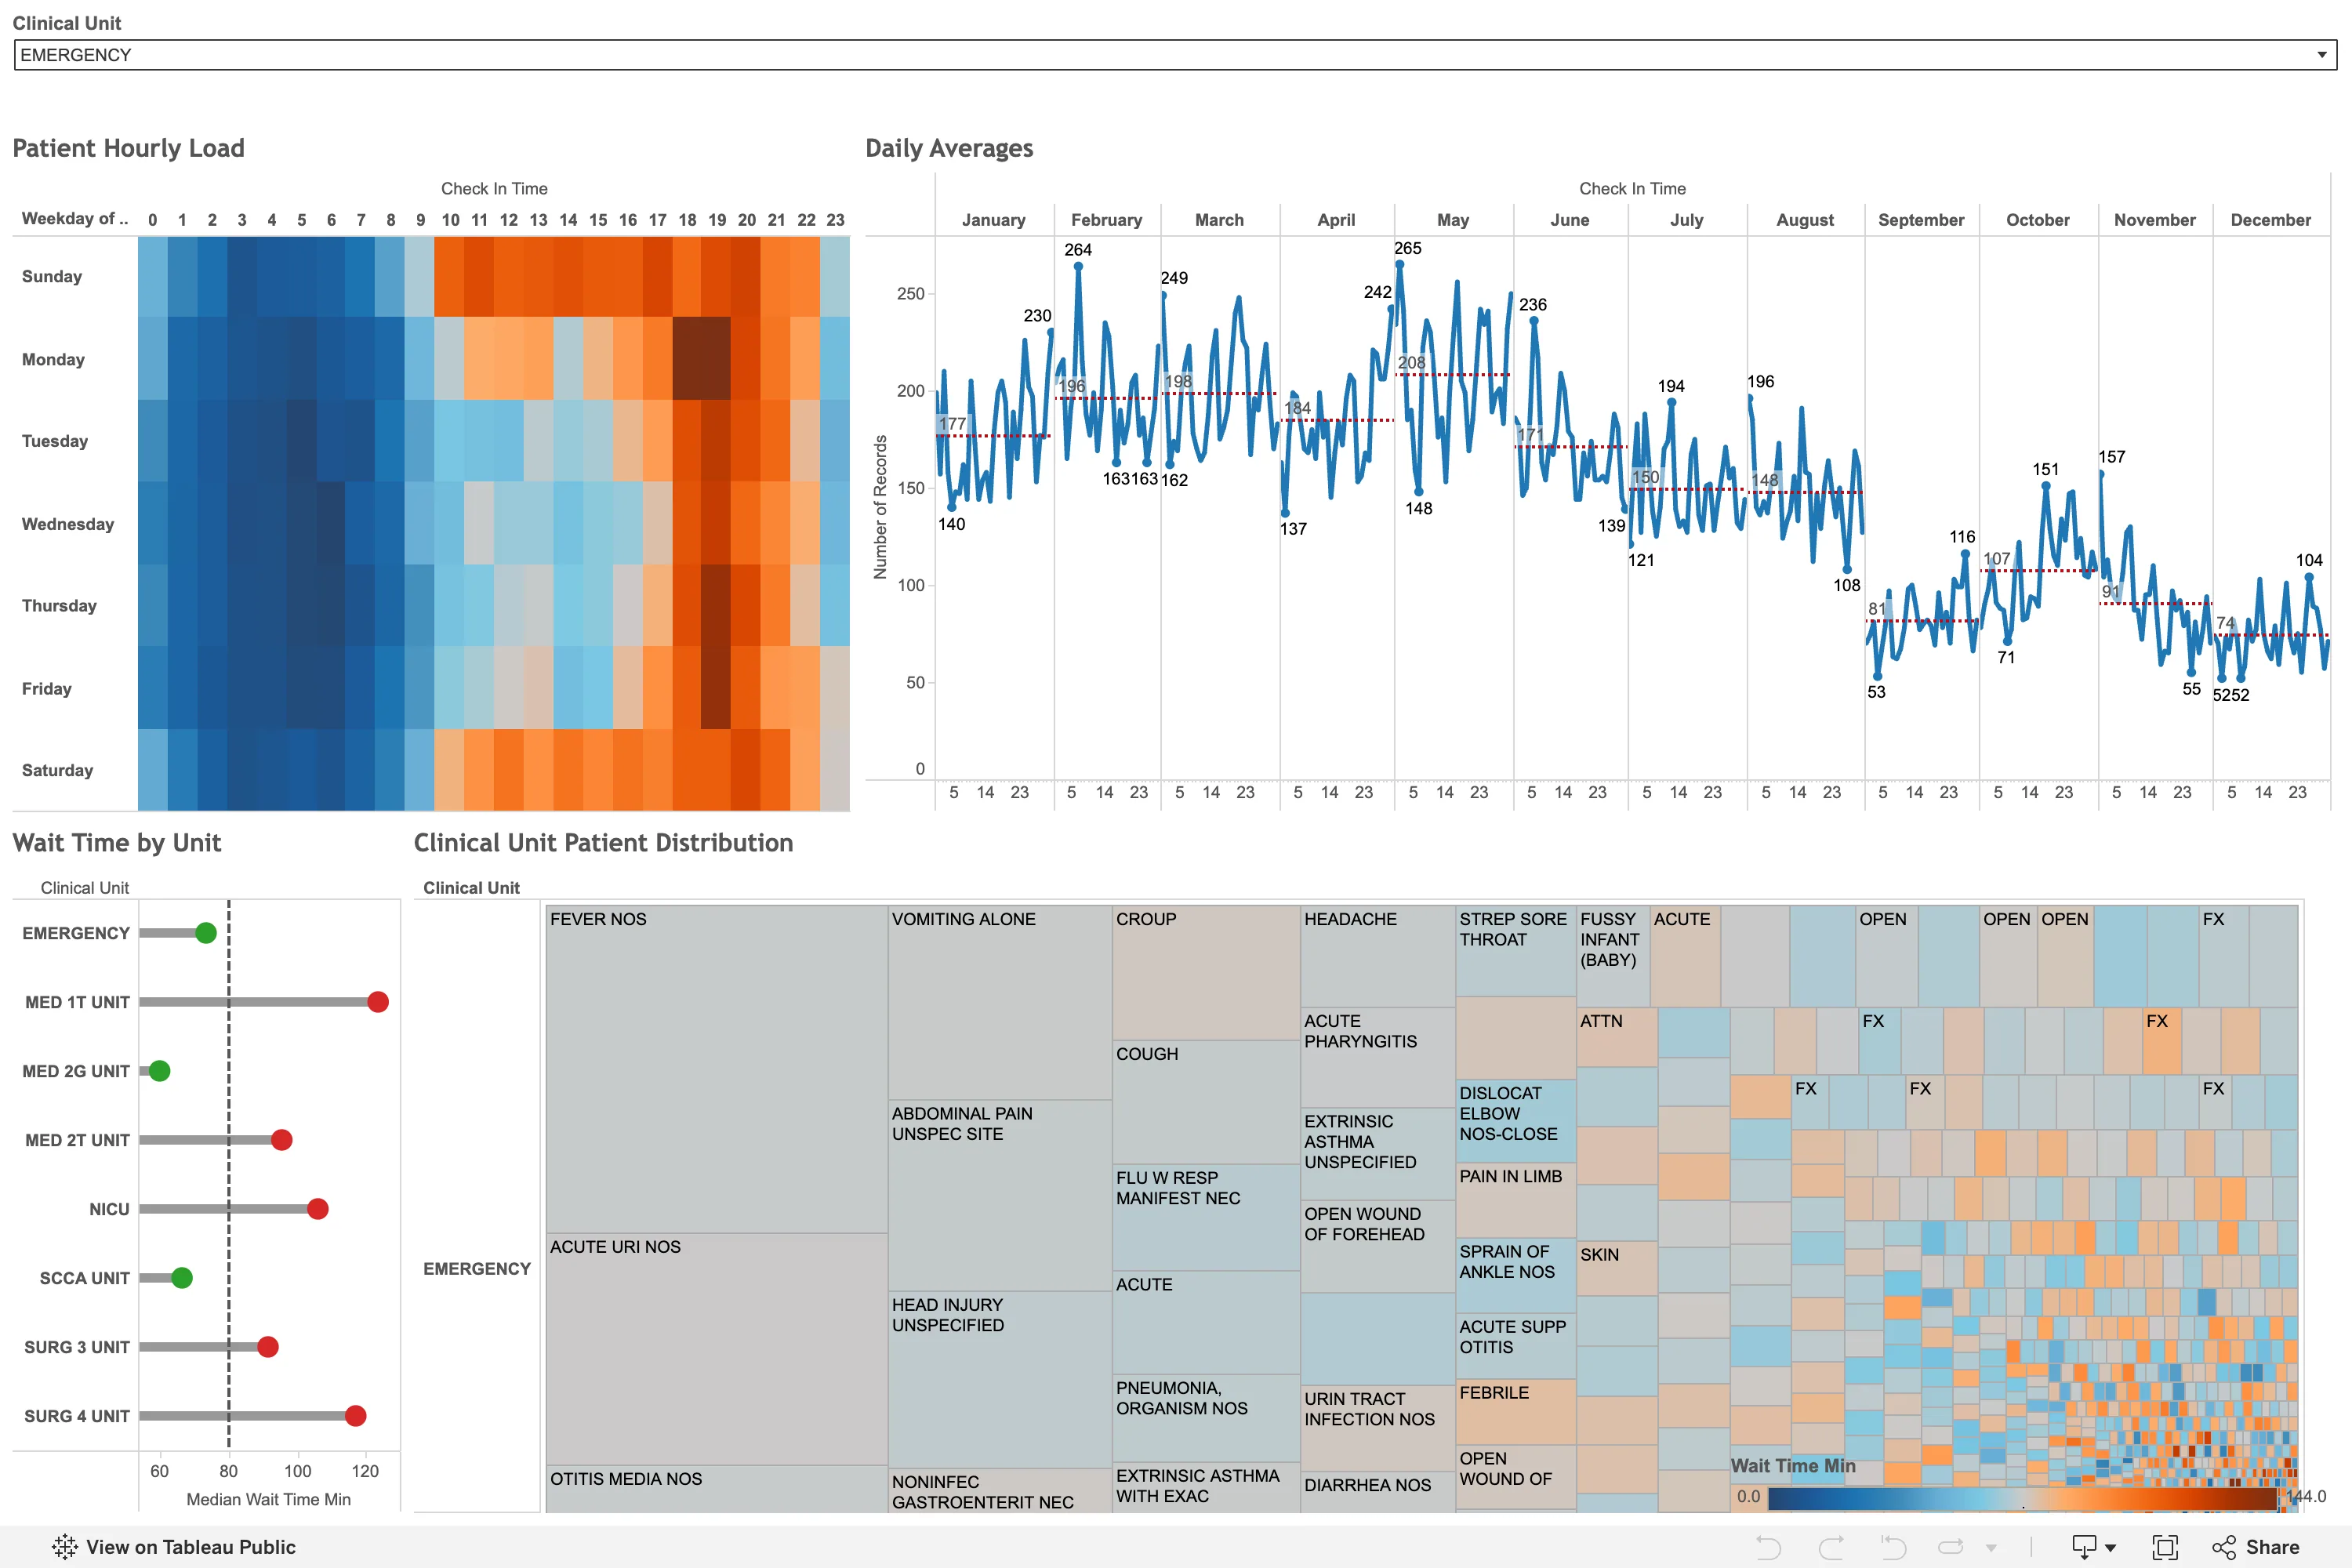
Sequential and diverging scales. A diverging scale for wait time needs an explained reference point. Small multiples. Monthly panels share a vertical scale for comparison. Calendar heatmap. The hour-by-weekday grid reveals recurring busy periods. Target and progress. Each unit is compared with a median reference line. Filter bar. The dropdown shows the selection applied to the view.
- Calendar heatmap The hour-by-weekday grid reveals recurring busy periods.
- Small multiples Monthly panels share a vertical scale for comparison.
- Sequential and diverging scales A diverging scale for wait time needs an explained reference point.
- Target and progress Each unit is compared with a median reference line.
- Filter bar The dropdown shows the selection applied to the view.
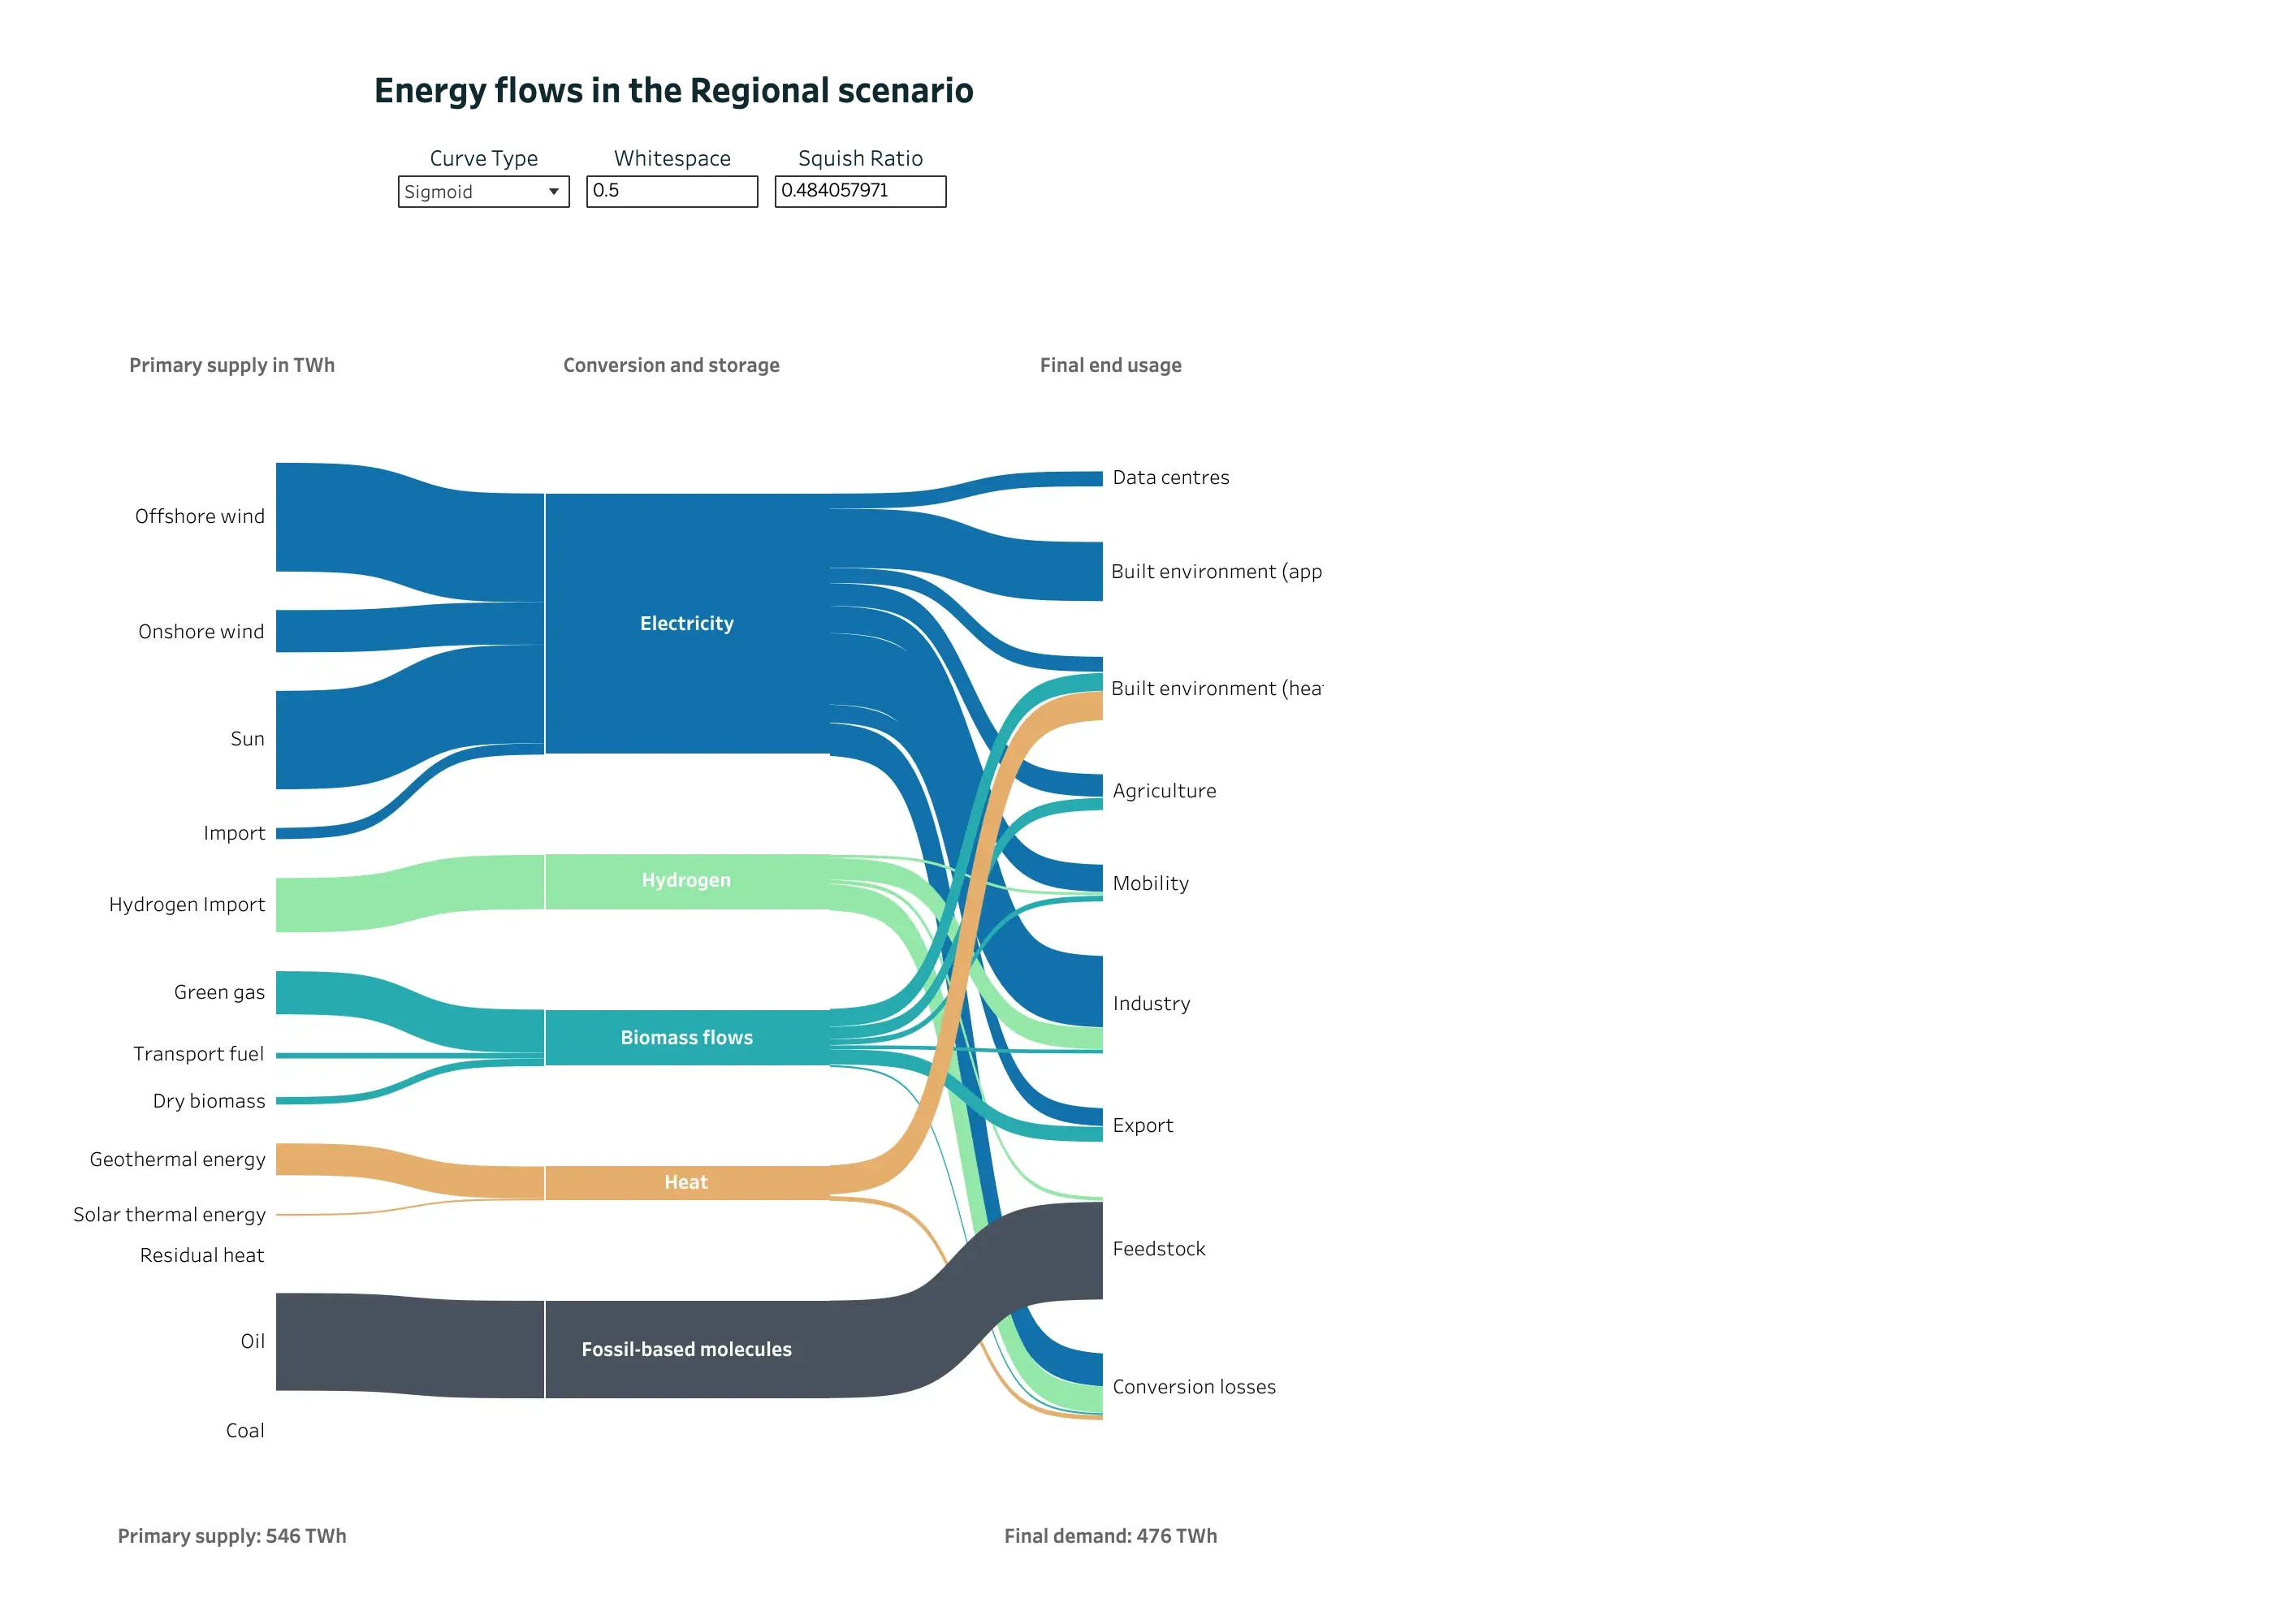
Sankey and path. Band widths show quantity across three sets of nodes. Categorical series palette. Consistent carrier colors help people follow bands across columns. Ratio and rate. Supply and demand totals let readers check the overall quantities. Dashboard builder. Layout controls expose technical settings alongside the data. Sankey and path. Conversion losses have an explicit destination.
- Sankey and path Band widths show quantity across three sets of nodes.
- Sankey and path Conversion losses have an explicit destination.
- Ratio and rate Supply and demand totals let readers check the overall quantities.
- Categorical series palette Consistent carrier colors help people follow bands across columns.
- Dashboard builder Layout controls expose technical settings alongside the data.
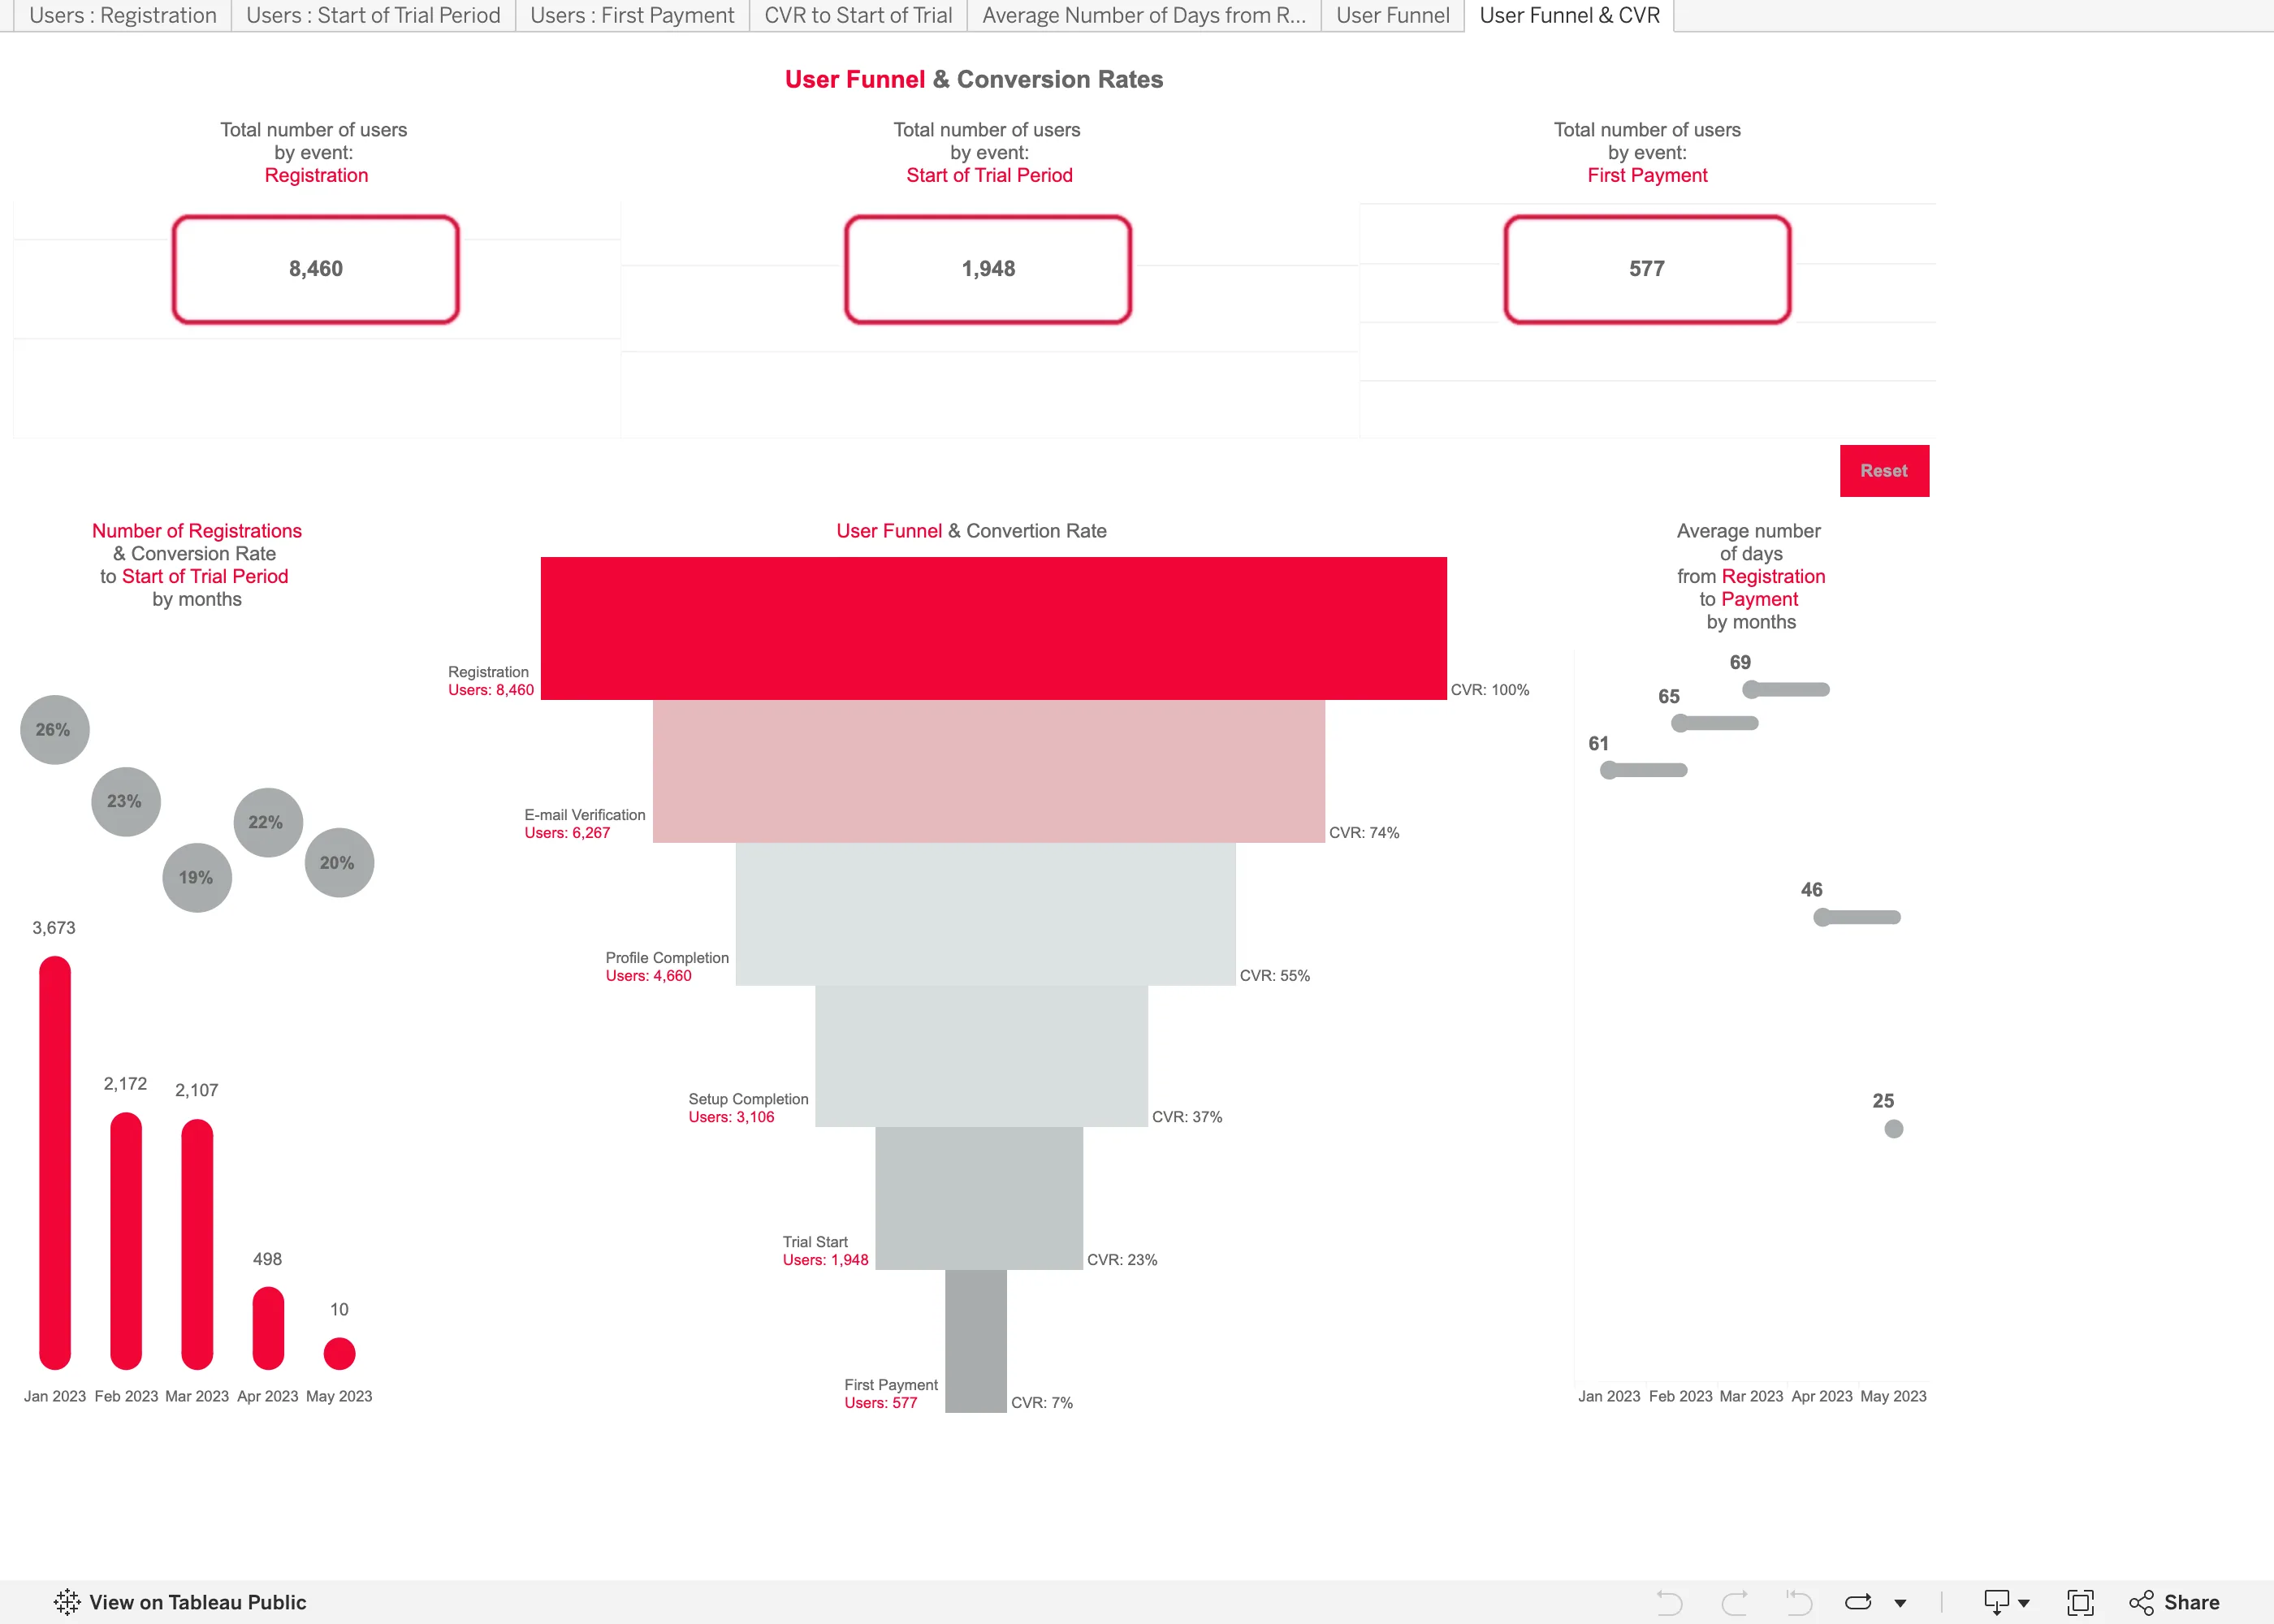
Funnel. The tapered shape makes step quantities harder to compare than aligned bars. Header KPI strip. Summary counts appear without a comparison value. Funnel. Only overall conversion is labeled; step-to-step conversion requires calculation. Ratio and rate. Similar-looking rates are based on very different registration counts. Tabs as genres. Worksheet tabs use metric names that may need explanation.
- Funnel The tapered shape makes step quantities harder to compare than aligned bars.
- Funnel Only overall conversion is labeled; step-to-step conversion requires calculation.
- Ratio and rate Similar-looking rates are based on very different registration counts.
- Header KPI strip Summary counts appear without a comparison value.
- Tabs as genres Worksheet tabs use metric names that may need explanation.
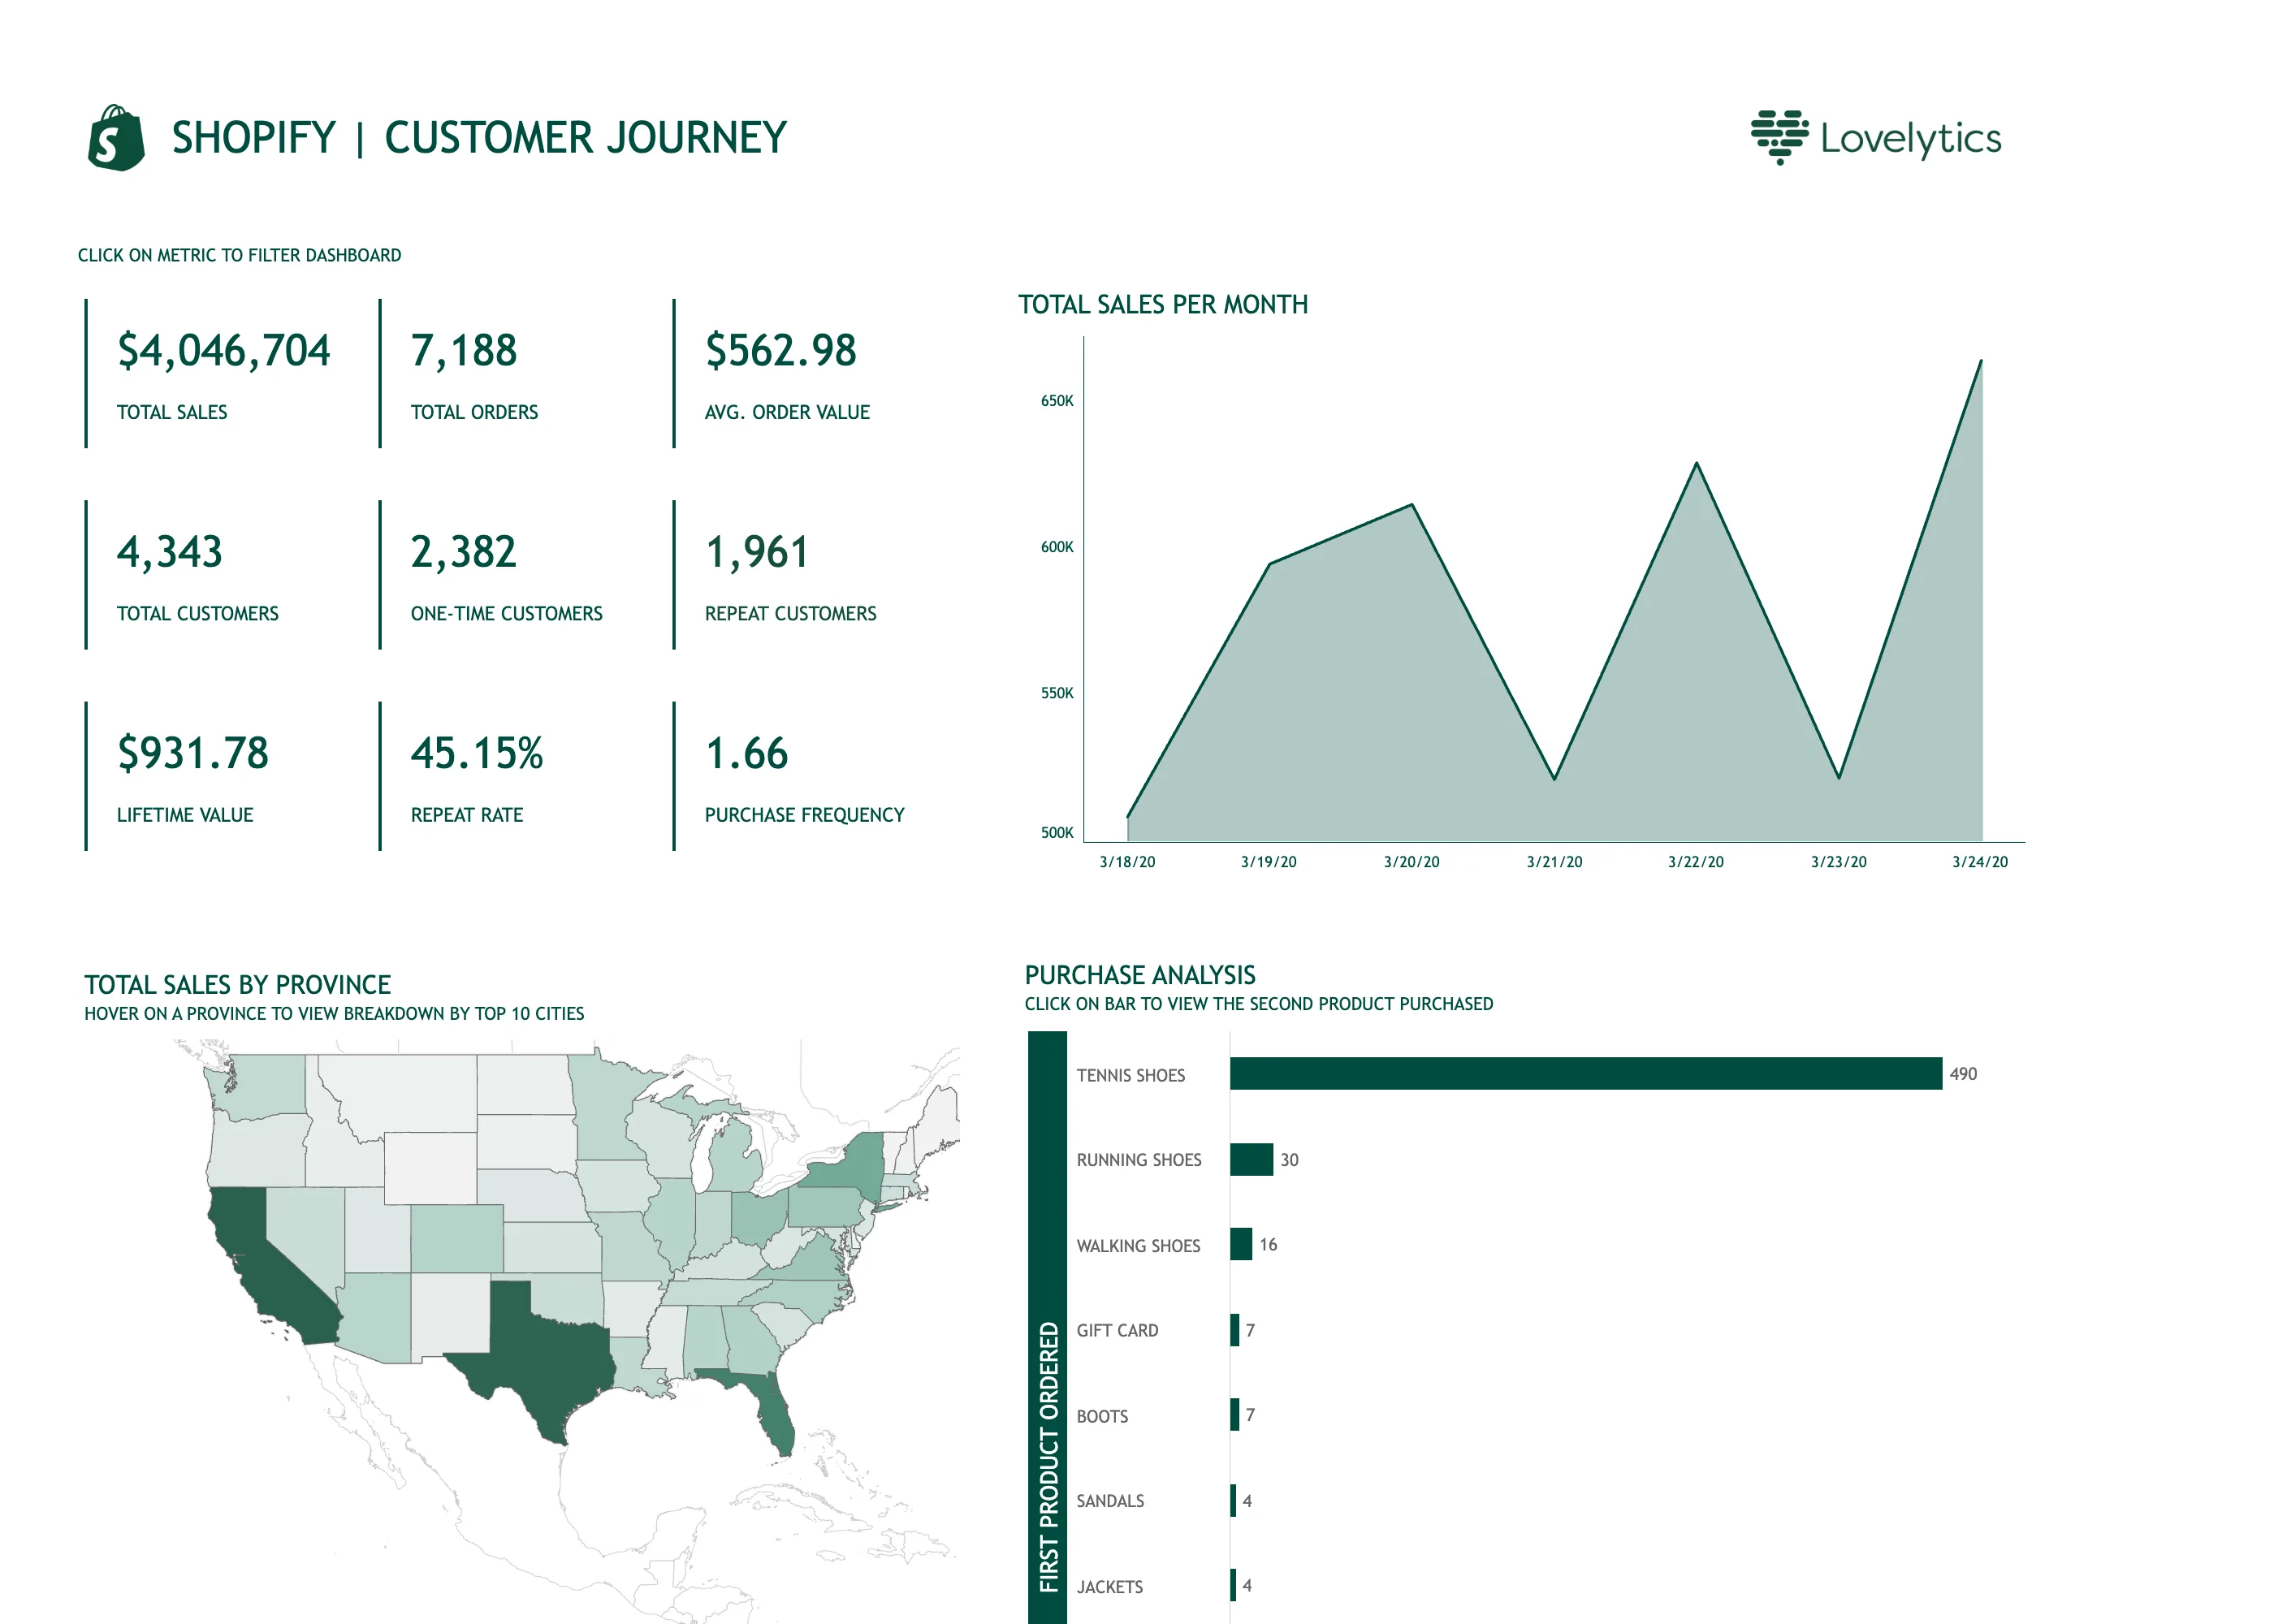
Ranked list. One much larger value leaves the remaining bars difficult to compare. Time series. The title and displayed period differ, and the vertical axis starts above zero. Geo map with markers. The map shows raw sales totals, which also reflect differences between populations. Header KPI strip. Nine values share a grid without a clear starting priority. Cross-filter. An instruction explains that metric tiles filter the dashboard. Hover detail. City details are described as available on hover.
- Cross-filter An instruction explains that metric tiles filter the dashboard.
- Header KPI strip Nine values share a grid without a clear starting priority.
- Time series The title and displayed period differ, and the vertical axis starts above zero.
- Hover detail City details are described as available on hover.
- Geo map with markers The map shows raw sales totals, which also reflect differences between populations.
- Ranked list One much larger value leaves the remaining bars difficult to compare.